Figures & data
Figure 1. Establishment of AOs and ALI-AECs from Eonycteris spelaea. Schematic illustration of the isolation and expansion of bat airway progenitor/stem cells (Stage 1), Transwell differentiation into ALI-AECs (State 2), mature AO differentiation (Stage 3), and the recursive generation of ALI-AECs from AOs (Stage 4). Inset: Bat trachea tissue, with 1 cm marker for scale. Pause points: The culture protocol can be halted at the indicated points, and single-cell suspensions frozen in liquid nitrogen for revival later.
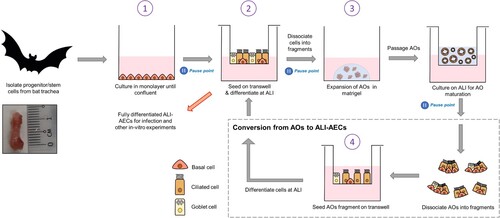
Figure 2. Characterization of bat AO and ALI-AECs. (A) Immunofluorescence staining of progenitor/stem cells for basal cell marker P63 (green) and cell nuclei (DAPI, blue). Scale bar = 50 μΜ. (B) Immunofluorescence staining of ALI-AECs for P63 (green), ciliated cell marker acetylated-α-tubulin (purple) or β-IV-tubulin (green, for cross-section image), and goblet cell marker MUC5AC (green, absent). Cell nuclei and F-actin are counterstained with DAPI (blue) and phalloidin (red). Scale bar = 50 μΜ. (C) Bright field images of bat organoids at day 7, 14, 28 and 42 of differentiation. Scale bar = 100 μΜ. (D) Differentiated bat organoids in basal-out or apical-out orientation stained for P63 (green), acetylated-α-tubulin (purple), F-actin (red) and nucleus (blue). Scale bar = 50 μΜ.
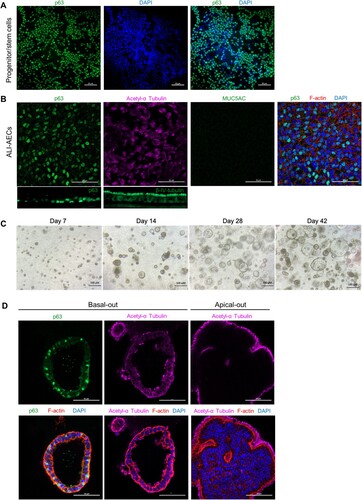
Figure 3. Gene expression changes during bat airway epithelial cell differentiation. qRT-PCR analysis of progenitor/stem cells, ALI-AECs and AOs for basal cell markers P63 and DLK2, ciliated cell markers FOXJ1 and MLF1 and goblet cell markers MUC5AC and BPIFB1. n = 6 biologically independent bat donors are illustrated. Each dot represents airway culture derived from a different bat donor. Each bar represents the mean. * indicates Student's t-test p-value <0.05, ** indicates Student's t-test p-value <0.01 for the indicated comparisons.
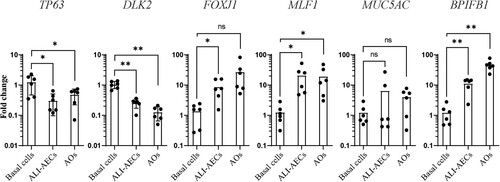
Figure 4. Human IL-13 (hIL-13) treatment promotes goblet cell differentiation in ALI-AECs. (A) Schematic representation of culture protocol with and without hIL-13 (10 ng/ml) treatment. (B) Untreated or hIL-13 treated ALI-AECs stained for P63 (green), acetylated-α-tubulin (purple), F-actin (red) and nucleus (blue). Scale bar = 50 μΜ. (C) Alcian blue staining of untreated or hIL-13 treated ALI-AEC cross sections. Representative results from two individual bat derived AECs are shown. Scale bar = 10 μΜ (D) qRT-PCR analysis of untreated or hIL-13 treated ALI-AECs for indicated marker genes. n = 6 biologically independent bat donors are illustrated. Each dot represents airway culture derived from a different bat donor. Each bar represents the mean. * indicates Student's t-test p-value <0.05, ** indicates Student's t-test p-value <0.01 for the indicated comparison.
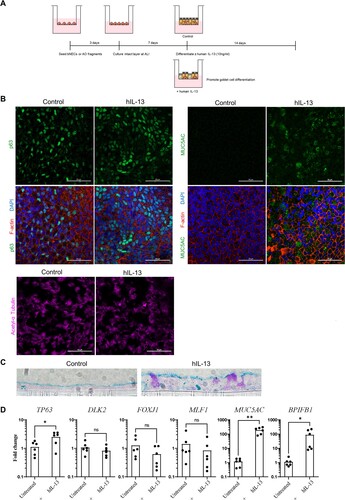
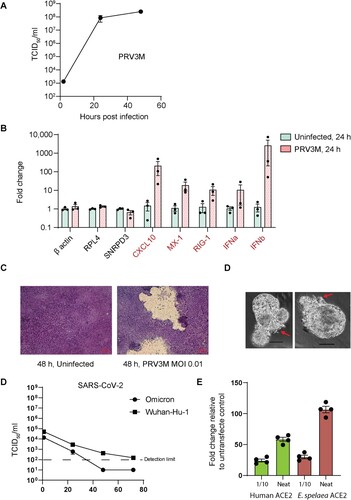
Figure 5. hIL-13 treated ALI-AECs are susceptible to PRV3M (Melaka virus) infection but not to SARS-CoV-2 infection. (A) Viral replication kinetics of PRV3M released from the apical surface of infected ALI-AECs at 1, 24 and 48 hpi. Each dot represents data from a biologically independent bat donor, n = 3. Data represented as mean ± SEM. (B) qRT-PCR analysis of uninfected or PRV3M-infected ALI-AECs at 24 hpi for housekeeping genes β-actin, RPL4 and SNRPD3, Type I IFNs (IFNα and IFNβ) and ISGs CXCL10, MX-1 and RIG-I. Each dot represents data from a biologically independent bat donor, n = 3. Data are presented as mean ± SEM. (C) Bright field images of Giemsa stained TransWell membranes of uninfected or PRV3M-infected ALI-AECs. Scale bar = 20 μΜ. (D) Bright field images of PRV3M infected organoids at 48 h post-infection. Red arrows indicate damage to organoid epithelial structure. Scale bar = 20 μΜ. (E) Viral replication kinetics of indicated SARS-CoV-2 strains released from the apical surface of infected AECs at 1, 24, 48 and 72 hpi. Each dot represents data from a biologically independent bat donor, n = 3. (F) Fold change in luminescence upon infection of HEK293T cells over-expressing either human or E. spelaea ACE2-FLAG with SARS-CoV-2 spike pseudovirus, relative to reading from untransfected cells.