
Figures & data
Table 1. Proportion of Enterobacter species and STs of carbapenem-resistant Enterobacter strains sequenced in this study.
Figure 1. A maximum-likelihood phylogenetic tree of ST171 E. xiangfangensis strains. A total of 278 ST171 E. xiangfangensis strains (including 14 sequenced in this study, and 264 from GenBank) were performed with phylogenetic analysis, while E. cloacae strain ATCC 13047 (GenBank accession number NC_014121) was used as the out group. Bar corresponds to scale of sequence divergence.
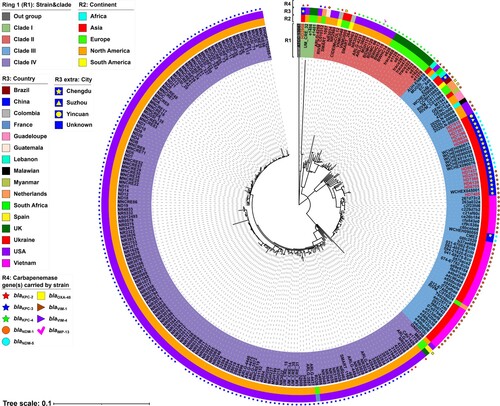
Figure 2. A maximum-likelihood phylogenetic tree of ST116 E. xiangfangensis strains. A total of 56 ST171 E. xiangfangensis strains (including 15 sequenced in this study, and 41 from GenBank) were performed with phylogenetic analysis, while E. cloacae strain ATCC 13047 (GenBank accession number NC_014121) was used as the out group. Bar corresponds to scale of sequence divergence.
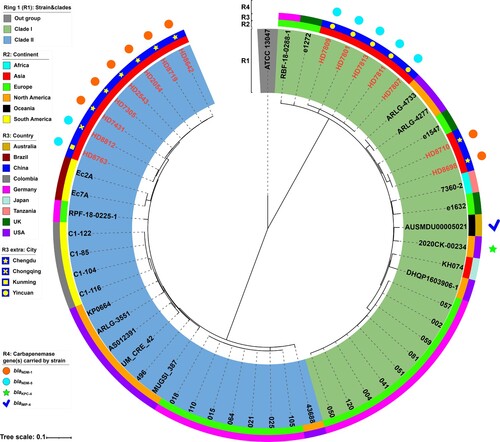
Table 2. Statistical analysis of Enterobacter strains sequenced in this study.
Figure 3. Growth curves of ST116, ST171 and other ST E. xiangfangensis strains. (a) Optical densities of strains in each group cultured in LB without antibiotic. (b) Optical densities of strains in each group cultured in LB with 2 μg/mL meropenem.
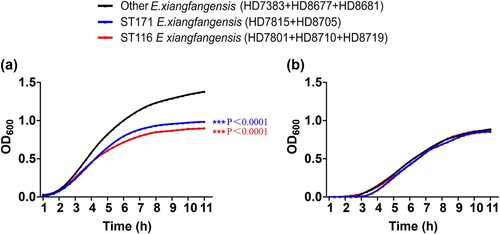
Figure 4. Linear comparison of carbapenemase-encoding plasmids from ST171 and ST116 E. xiangfangensis strains. Genes are denoted by arrows. Genes, mobile genetic elements and other features are coloured based on function classification. Shading regions denote homology of two plasmids (light blue: ≥ 99% nucleotide identity). The names of plasmids from ST171 E. xiangfangensis strains were marked in red, while ST116 E. xiangfangensis strains in blue. The names of reference plasmids were marked in black. The accession number of plasmids pNDM5_090011, pNDM-HN380, pNDM1_045001 and pCY-VIM used as reference are CP036312, JX104760, CP043383 and KF998104, respectively.
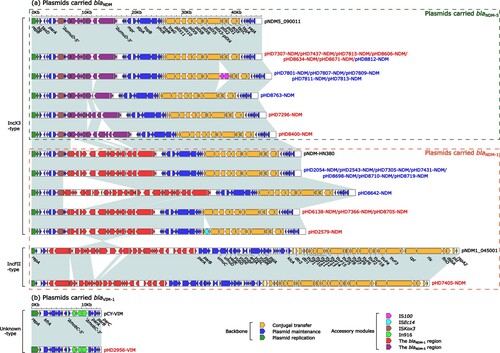
Figure 5. Organization of the blaNDM regions from blaNDM-harbouring plasmids. Genes are denoted by arrows. Genes, mobile genetic elements and other features are coloured based on their functional classification. Shading denotes regions of homology (light blue: ≥ 99% nucleotide identity). The accession number of Tn125 used as reference is JN872328 [Citation20].
![Figure 5. Organization of the blaNDM regions from blaNDM-harbouring plasmids. Genes are denoted by arrows. Genes, mobile genetic elements and other features are coloured based on their functional classification. Shading denotes regions of homology (light blue: ≥ 99% nucleotide identity). The accession number of Tn125 used as reference is JN872328 [Citation20].](/cms/asset/97b025f1-e831-4694-983c-6de3934410bf/temi_a_2148562_f0005_oc.jpg)
Supplemental Material
Download Zip (2.4 MB)Data availability statement
The data presented in the study are included in the article/supplementary files, further inquiries can be directed to the corresponding author/s.
Acknowledgments
The authors are grateful for professor Dongsheng Zhou from State Key Laboratory of Pathogen and Biosecurity, Beijing Institute of Microbiology and Epidemiology for the assistance in the drawing of figures.