2,880
Views
0
CrossRef citations to date
0
Altmetric
Research Article

A rabies virus-vectored vaccine expressing two copies of the Marburg virus glycoprotein gene induced neutralizing antibodies against Marburg virus in humanized mice

, , , , , , , , , , , & show all
Article: 2149351 | Received 13 Jul 2022, Accepted 15 Nov 2022, Published online: 28 Dec 2022

Figures & data

Figure 1. Construction and identification of recombinant rS-MARV virus. (A) The cDNA structures of the recombinant virus and parental SRV9 virus. The recombinant viruses encoding the two copies of MARV GP were named rS-2A, rS-2M, and rS-2R, respectively. The RABV GP gene was replaced with the MARV GP gene using the PstI and KpnI restriction sites. Another copy of the MARV GP gene was inserted between the P and M genes of the cDNA using the BsiWI and PmeI restriction sites. The three recombinant viruses are collectively referred to as rS-MARV. (B) Identification of recombinant viruses by immunofluorescence. A sample comprising 1 ml of the third blind serial passage supernatant after transfection was seeded into a 24-well plate in which BSR cells were cultured. Pre-chilled 80% acetone solution was used for cell fixation and permeabilization. Anti-RABV N (monoclonal antibody) and anti-MARV GP antibody (self-made rabbit serum) were used for identification, respectively. Cell supernatants not inoculated with viruses served as negative controls. (C) Identification of MARV GP1 subunits by western blot. A sample comprising 20 μg of purified virus particles as subjected to polyacrylamide gel electrophoresis. MR191 was used as the primary antibody (recognizing MARV GP1), and a HRP-conjugated anti-human IgG antibody was used as the secondary antibody for western blot identification. (D) The morphological characteristics of recombinant viruses were analysed by TEM.
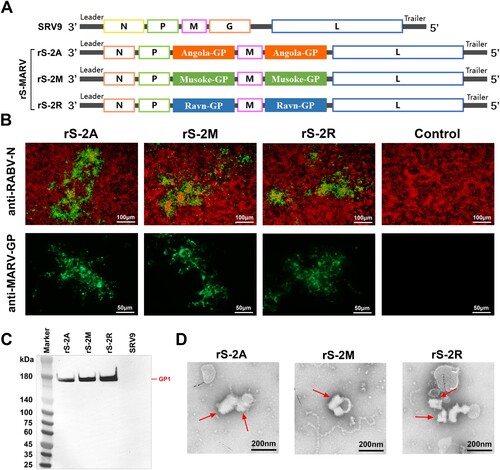
Figure 1. Construction and identification of recombinant rS-MARV virus. (A) The cDNA structures of the recombinant virus and parental SRV9 virus. The recombinant viruses encoding the two copies of MARV GP were named rS-2A, rS-2M, and rS-2R, respectively. The RABV GP gene was replaced with the MARV GP gene using the PstI and KpnI restriction sites. Another copy of the MARV GP gene was inserted between the P and M genes of the cDNA using the BsiWI and PmeI restriction sites. The three recombinant viruses are collectively referred to as rS-MARV. (B) Identification of recombinant viruses by immunofluorescence. A sample comprising 1 ml of the third blind serial passage supernatant after transfection was seeded into a 24-well plate in which BSR cells were cultured. Pre-chilled 80% acetone solution was used for cell fixation and permeabilization. Anti-RABV N (monoclonal antibody) and anti-MARV GP antibody (self-made rabbit serum) were used for identification, respectively. Cell supernatants not inoculated with viruses served as negative controls. (C) Identification of MARV GP1 subunits by western blot. A sample comprising 20 μg of purified virus particles as subjected to polyacrylamide gel electrophoresis. MR191 was used as the primary antibody (recognizing MARV GP1), and a HRP-conjugated anti-human IgG antibody was used as the secondary antibody for western blot identification. (D) The morphological characteristics of recombinant viruses were analysed by TEM.

Figure 2. Preliminary evaluation of proliferation characteristics and safety of recombinant rS-MARV virus. (A) RT-PCR to identify the stability of MARV GP gene insertion in the recombinant virus. Reverse RNA transcription was performed using oligo dT and random 6nt primers. Sequencing analysis of RT-PCR products to determine whether the MARV GP gene can be stably inherited. (B) Growth kinetics of rS-MARV. BSR cells were infected with rS-MARV and SRV9 (MOI = 0.5), the supernatant was collected for four consecutive days, and the virus titre was determined using an FITC-conjugated anti-RABV N antibody. Each sample is repeated 3 times at each time point. (C) Pathogenicity evaluation of rS-MARV. SRV9 and rS-MARV were intracerebrally injected into 3-day-old ICR suckling mice, and the survival of suckling mice was recorded for 30 consecutive days. (D) Histopathological analysis. Representative histological images of vaccinated mouse brains infected with rS-MARV. All images were observed at 400x magnification. The images show significantly reduced neuronal degeneration in the brains of mice inoculated with rS-MARV compared to inoculation with the parental virus SRV9.
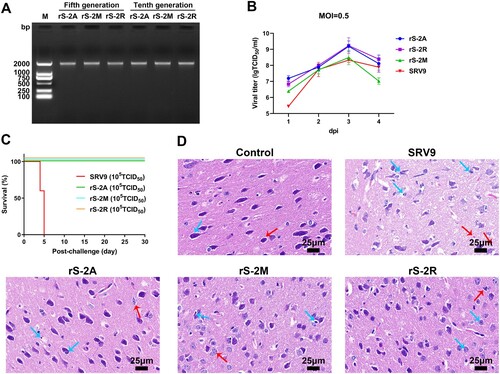
Figure 2. Preliminary evaluation of proliferation characteristics and safety of recombinant rS-MARV virus. (A) RT-PCR to identify the stability of MARV GP gene insertion in the recombinant virus. Reverse RNA transcription was performed using oligo dT and random 6nt primers. Sequencing analysis of RT-PCR products to determine whether the MARV GP gene can be stably inherited. (B) Growth kinetics of rS-MARV. BSR cells were infected with rS-MARV and SRV9 (MOI = 0.5), the supernatant was collected for four consecutive days, and the virus titre was determined using an FITC-conjugated anti-RABV N antibody. Each sample is repeated 3 times at each time point. (C) Pathogenicity evaluation of rS-MARV. SRV9 and rS-MARV were intracerebrally injected into 3-day-old ICR suckling mice, and the survival of suckling mice was recorded for 30 consecutive days. (D) Histopathological analysis. Representative histological images of vaccinated mouse brains infected with rS-MARV. All images were observed at 400x magnification. The images show significantly reduced neuronal degeneration in the brains of mice inoculated with rS-MARV compared to inoculation with the parental virus SRV9.

Figure 3. Humoral response to rS-MARV. (A) Immunization and experimental schedule. The abscissa represents the serum dilution ratio, and the ordinate represents the absorbance. The BALB/c mice (n = 6/group) were immunized with 20 μg of inactivated rS-MARV suspended in AddaVax adjuvant. The vaccine was injected into the hindlimb muscle of the mice. All mice were primed on day 0 and boosted on days 14 and 21. The minimum dilution of serum is 20. (B) Three sera recovered from immunized mice were randomly selected and diluted at 1:30 to prevent matrix effects. Indirect ELISA analysed serial 3-fold dilutions of serum samples to test the relative amounts of MARV GP-specific antibodies. Serum samples were tested 14 days after the final immunization (35 dpi) to characterize the persistence of the antibody response. The OD450 values at each dilution factor were fitted to a 4-parameter nonlinear equation to facilitate observation of trends. Negative control is PBS group. (C) The IgG isotype response of immunized mice was assessed by indirect ELISA 21 days after vaccination to assess Th1 versus Th2 biased humoral immunity. (D) Mouse sera were analysed using a lentiviral pseudovirus carrying a luciferase reporter gene. The 20-fold diluted mouse serum was used as the initial concentration for the pseudovirus neutralization assay. Neutralizing activity was defined as a reduction of luciferase activity by more than 50%. The image shows the neutralization titre of mouse sera sampled at 21 dpi. Negative control is PBS group. The minimum dilution of serum is 10.
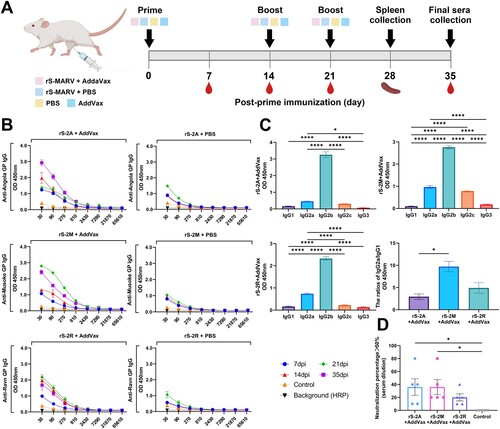
Figure 3. Humoral response to rS-MARV. (A) Immunization and experimental schedule. The abscissa represents the serum dilution ratio, and the ordinate represents the absorbance. The BALB/c mice (n = 6/group) were immunized with 20 μg of inactivated rS-MARV suspended in AddaVax adjuvant. The vaccine was injected into the hindlimb muscle of the mice. All mice were primed on day 0 and boosted on days 14 and 21. The minimum dilution of serum is 20. (B) Three sera recovered from immunized mice were randomly selected and diluted at 1:30 to prevent matrix effects. Indirect ELISA analysed serial 3-fold dilutions of serum samples to test the relative amounts of MARV GP-specific antibodies. Serum samples were tested 14 days after the final immunization (35 dpi) to characterize the persistence of the antibody response. The OD450 values at each dilution factor were fitted to a 4-parameter nonlinear equation to facilitate observation of trends. Negative control is PBS group. (C) The IgG isotype response of immunized mice was assessed by indirect ELISA 21 days after vaccination to assess Th1 versus Th2 biased humoral immunity. (D) Mouse sera were analysed using a lentiviral pseudovirus carrying a luciferase reporter gene. The 20-fold diluted mouse serum was used as the initial concentration for the pseudovirus neutralization assay. Neutralizing activity was defined as a reduction of luciferase activity by more than 50%. The image shows the neutralization titre of mouse sera sampled at 21 dpi. Negative control is PBS group. The minimum dilution of serum is 10.

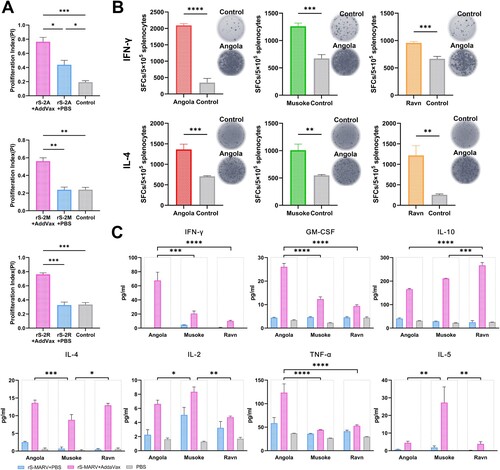
Figure 4. Cellular immunologic response to rS-MARV. One week after the last immunization, mouse spleens (n = 3/group) were collected, and spleen cells were re-stimulated with purified MARV GP. The stimulator concentration was 10 μg/ml, 10 μl per well of a 96-well plate. All samples were replicated 3 times, and data are presented as means ± SEM for each group. (A) Specific splenocyte proliferation. The CCK-8 assay was used to calculate the proliferation index. AddaVax-vaccinated mice served as negative controls. (B) The levels of IFN-γ and IL-4 secreted by splenocytes were measured using the ELISpot assay. The abscissa indicates the corresponding protein stimulus. AddaVax-vaccinated mice served as negative controls. (C) The Luminex method was used to determine cytokine levels in the culture supernatants of splenocytes. The differences in the specific secretion of cytokines by splenocytes after rS-2A, rS-2M, and rS-2R immunization were compared under the premise of considering each rS-MARV grouping. The abscissa indicates different MARV GP stimuli. Angola corresponds to rS-2A, Musoke corresponds to rS-2M, and Ravn corresponds to rS-2R. The fluorescence signals of the standards were fitted to a 5-parameter curve in Luminex200 software. RIFNγ2 = 0.961, RGMCSF2 = 0.992, RIL102 = 0.998, RIL42 = 0.926, RIL22 = 0.950, RTNFα2 = 0.995, RIL52 = 0.989, 3 decimal places.

Figure 4. Cellular immunologic response to rS-MARV. One week after the last immunization, mouse spleens (n = 3/group) were collected, and spleen cells were re-stimulated with purified MARV GP. The stimulator concentration was 10 μg/ml, 10 μl per well of a 96-well plate. All samples were replicated 3 times, and data are presented as means ± SEM for each group. (A) Specific splenocyte proliferation. The CCK-8 assay was used to calculate the proliferation index. AddaVax-vaccinated mice served as negative controls. (B) The levels of IFN-γ and IL-4 secreted by splenocytes were measured using the ELISpot assay. The abscissa indicates the corresponding protein stimulus. AddaVax-vaccinated mice served as negative controls. (C) The Luminex method was used to determine cytokine levels in the culture supernatants of splenocytes. The differences in the specific secretion of cytokines by splenocytes after rS-2A, rS-2M, and rS-2R immunization were compared under the premise of considering each rS-MARV grouping. The abscissa indicates different MARV GP stimuli. Angola corresponds to rS-2A, Musoke corresponds to rS-2M, and Ravn corresponds to rS-2R. The fluorescence signals of the standards were fitted to a 5-parameter curve in Luminex200 software. RIFN−γ2 = 0.961, RGM−CSF2 = 0.992, RIL−102 = 0.998, RIL−42 = 0.926, RIL−22 = 0.950, RTNF−α2 = 0.995, RIL−52 = 0.989, 3 decimal places.

Figure 5. MARV-specific lymphocyte activation. Activation of lymphocytes induced by the inactivated virus vaccine was assessed by flow cytometry, including effector T cells (A,B), plasma cells (C,D), and memory B cells (E,F). All splenocytes were isolated on day 28 after primary immunization. The purified protein corresponding to the vaccine was used as a stimulus. Splenocytes of mice inoculated with AddaVax were included as a negative control. (A,C,E) show representative plots of lymphocyte populations from each group. (B) The CD4+ and CD8+ T cell ratio in the total lymphocyte population reflects the T cell immune response. (D,F) compare the proportion of plasma and memory B cells to total B cells.
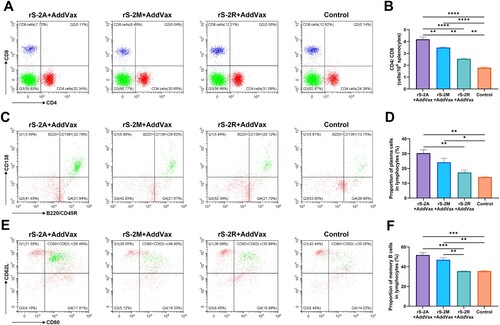
Figure 5. MARV-specific lymphocyte activation. Activation of lymphocytes induced by the inactivated virus vaccine was assessed by flow cytometry, including effector T cells (A,B), plasma cells (C,D), and memory B cells (E,F). All splenocytes were isolated on day 28 after primary immunization. The purified protein corresponding to the vaccine was used as a stimulus. Splenocytes of mice inoculated with AddaVax were included as a negative control. (A,C,E) show representative plots of lymphocyte populations from each group. (B) The CD4+ and CD8+ T cell ratio in the total lymphocyte population reflects the T cell immune response. (D,F) compare the proportion of plasma and memory B cells to total B cells.

Figure 6. Discovery of fully humanized monoclonal antibodies against MARV. (A) Sequential immunization strategy of antibody-humanized transgenic CAMouse mice. Each mouse was inoculated with 100 μg of inactivated BCG to mobilize the immune system of the mice on day 0. DNA vaccine was used for primary sequential immunization, and inactivated rS-2A was used as a booster. Final stimulation with MARV GP was performed 3 days before cell fusion (105 dpi). (B,C) show mouse-specific IgG titres and neutralizing antibody titres at 105 dpi, respectively. The abscissa of (B) is the serum dilution. (D) Indirect ELISA screening of the culture supernatant of 8544 hybridoma cell lines. The abscissa indicates the plate number, and the ordinate indicates the well number. The response value is the absorbance at 450 nm (OD450). The heatmap is normalized, and red indicates a high absorbance value. (E) Pan-pseudovirus neutralizing activity of 60H07 against different MARV strains. 60H07 is expressed by 293 T cells.
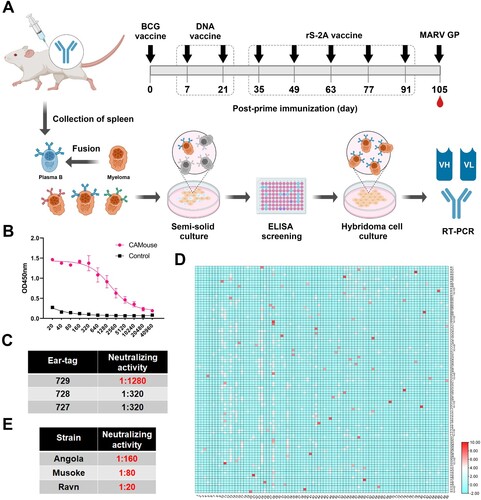
Figure 6. Discovery of fully humanized monoclonal antibodies against MARV. (A) Sequential immunization strategy of antibody-humanized transgenic CAMouse mice. Each mouse was inoculated with 100 μg of inactivated BCG to mobilize the immune system of the mice on day 0. DNA vaccine was used for primary sequential immunization, and inactivated rS-2A was used as a booster. Final stimulation with MARV GP was performed 3 days before cell fusion (105 dpi). (B,C) show mouse-specific IgG titres and neutralizing antibody titres at 105 dpi, respectively. The abscissa of (B) is the serum dilution. (D) Indirect ELISA screening of the culture supernatant of 8544 hybridoma cell lines. The abscissa indicates the plate number, and the ordinate indicates the well number. The response value is the absorbance at 450 nm (OD450). The heatmap is normalized, and red indicates a high absorbance value. (E) Pan-pseudovirus neutralizing activity of 60H07 against different MARV strains. 60H07 is expressed by 293 T cells.

Figure 7. Properties of fully humanized MARV antibodies obtained from transgenic CAMouse mice. (A) Identification of antibody light chain isotypes. Double-antibody sandwich ELISA was used to differentiate antibody light chain isotypes. (B) RT-PCR amplified antibody sequences. Total RNA from hybridoma cells was extracted and reverse transcribed into cDNA. Multiplex PCR was used to amplify antibody VH and VK sequences. The VH band was approximately 740 bp, and the VK band was approximately 630 bp. (C,D) show the amino acid sequences of antibody VH and VK chains, respectively. The antibody's CDRs are marked in red, and the framework regions (FRs) show differential amino acids.
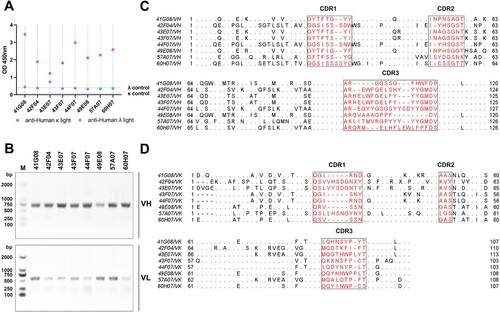
Figure 7. Properties of fully humanized MARV antibodies obtained from transgenic CAMouse mice. (A) Identification of antibody light chain isotypes. Double-antibody sandwich ELISA was used to differentiate antibody light chain isotypes. (B) RT-PCR amplified antibody sequences. Total RNA from hybridoma cells was extracted and reverse transcribed into cDNA. Multiplex PCR was used to amplify antibody VH and VK sequences. The VH band was approximately 740 bp, and the VK band was approximately 630 bp. (C,D) show the amino acid sequences of antibody VH and VK chains, respectively. The antibody's CDRs are marked in red, and the framework regions (FRs) show differential amino acids.

Figure 8. Simulated docking of antibody 60H07 with the Ravn GP antigen. The structure of 60H07 was predicted using the IgFold algorithm. The HADDOCK method was used to simulate antigen-antibody binding, and the RBS region was used as the approximate action site for docking with default parameters. The model with the highest score was used for subsequent analysis. Binding residues were predicted using the LigPlus algorithm. (A) Structural model of antibody 60H07. The spatial structure of the CDRs is shown in red. Green and blue are used to distinguish between heavy and light chains. (B) Spatial docking model of 60H07 with MARV GP. Comparison with known antibody-binding epitopes of MARV. The red box highlights the overlapping binding positions of 60H07 and MR78 to GP. (C) The detailed site of MR78 binding to GP was based on a published crystal structure (PDB ID: 5UQY). (D) Key predicted site of 60H07 binding to Ravn GP.
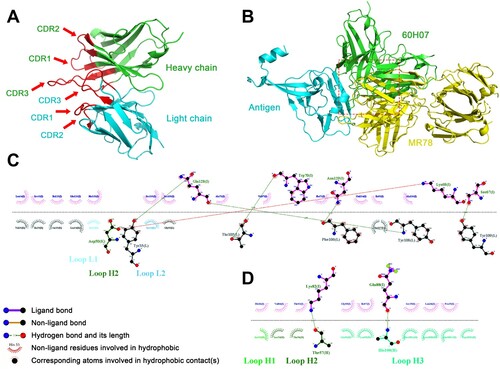
Figure 8. Simulated docking of antibody 60H07 with the Ravn GP antigen. The structure of 60H07 was predicted using the IgFold algorithm. The HADDOCK method was used to simulate antigen-antibody binding, and the RBS region was used as the approximate action site for docking with default parameters. The model with the highest score was used for subsequent analysis. Binding residues were predicted using the LigPlus algorithm. (A) Structural model of antibody 60H07. The spatial structure of the CDRs is shown in red. Green and blue are used to distinguish between heavy and light chains. (B) Spatial docking model of 60H07 with MARV GP. Comparison with known antibody-binding epitopes of MARV. The red box highlights the overlapping binding positions of 60H07 and MR78 to GP. (C) The detailed site of MR78 binding to GP was based on a published crystal structure (PDB ID: 5UQY). (D) Key predicted site of 60H07 binding to Ravn GP.
Supplemental material

Supplemental Material

Download Zip (2 MB)