
Figures & data
Figure 1. Number of H6 AIVs in China during 2000-2021. (A) General profile of H6 AIVs isolated in China from 2000 to 2021. (B) Time-dependent changes in the total number of H6 AIVs in China from 2000 to 2021.
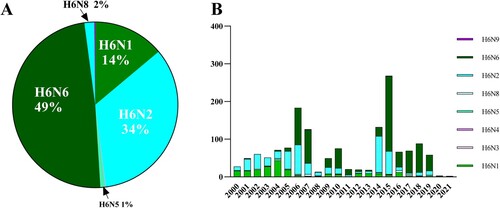
Figure 2. Geographical distribution of H6 AIVs in China from 2000 to 2021. Each H6 subtype is shown as a specific colour. An increase in the size of the circles indicates an increased in the number of H6 AIV incidences. XJ, Xinjiang Uygur Autonomous Region; NM, Inner Mongolia; HLJ, Heilongjiang; HeN, Henan; SD, Shandong; JS, Jiangsu; SH, Shanghai; ZJ, Zhejiang; HB, Hubei; HuN, Hunan; JX, Jiangxi; AH, Anhui; FJ, Fujian; GD, Guangdong; GX, Guangxi; HaiN, Hainan; SC, Sichuan; YN, Yunnan; GZ, Guizhou; CQ, Chongqing; HK, Hong Kong; TW, Taiwan.
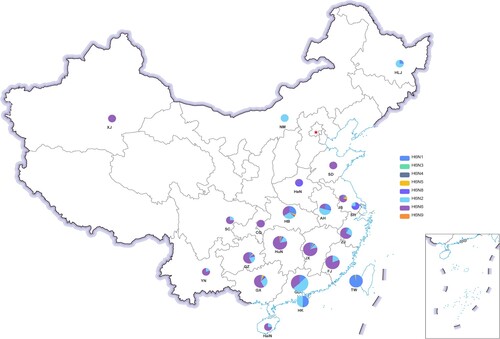
Figure 3. Phylogenetic tree of HA genes of H6 viruses. For the 171 H6 viruses sequenced in this study, all eight gene segments are listed at the top of the graph, and the clade origins of each gene segment are indicated by different coloured bars. White bars represent gene segments of reference strains downloaded from GISAID or GenBank. Surface genes (HA and NA) were generally classified into four separate clusters (ST-339-like, ST-2853/HN-573-like, ST-192-like and N8-like), while internal genes (PB1, PB2, PA, NP, M, NS) were included in five separate clusters.
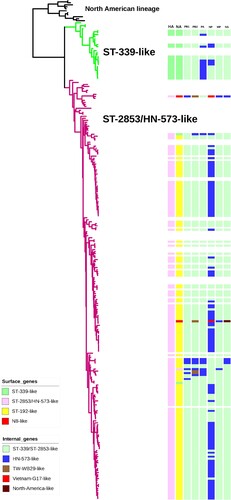
Figure 4. Development of H6Nx genotypes during 2009–2021. (A) Geographical distribution of H6Nx AIV genotypes in each province. The eight gene segments are shown as horizontal bars, starting from top to bottom of the virion, PB2, PB1, PA, HA, NP, NA, M and NS. Different colours represent different virus lineages. (B) Sixteen distinct genotypes are listed on the left. Coloured circles represent different genotypes and the isolation time.
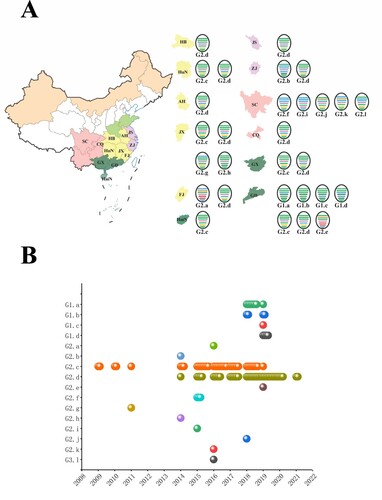
Figure 5. H6N6 AIV characterization in mice Bodyweight loss (A) and survival rate (B) of mice infected with various H6N6 strains. Groups of mice (n = 5) were intranasally infected with 107 EID50 of each virus. Bodyweight loss and survival of mice were monitored until 14 dpi. Statistical significance of the survival curve was determined using a Log-rank (Mantel–Cox) test. (C) Viral replication efficiency in the different tissues of mice was analysed by inoculating mice (n = 5 per group) intranasally with 107 EID50 of each virus.
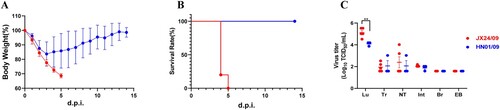
Figure 6. Virulence and replication of JX24/09 and HN01/09 in mice. Five mice per group were inoculated intranasally with PBS (control) or with 101–107 EID50 of JX24/09 or HN01/09. Bodyweight changes (A) and survival of mice (B) were monitored daily. Statistical significance of the survival curve was determined using a Log-rank (Mantel–Cox) test.
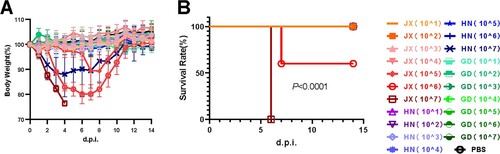
Table 1. Hemagglutinin inhibition antibody test of the C57BL/6 mice inoculated with JX/24/09 and HN/01/09.