
Figures & data
Figure 1. Timeline of events during hospitalization and follow-up. Key events included the symptom onset, admission, discharge, vaccination, and 2-year follow-up visit after discharge, with the discharge date normalized to Day 0 and the median time (IQR) to each stage marked on the right. Grey dots indicate samples collected at each time point.
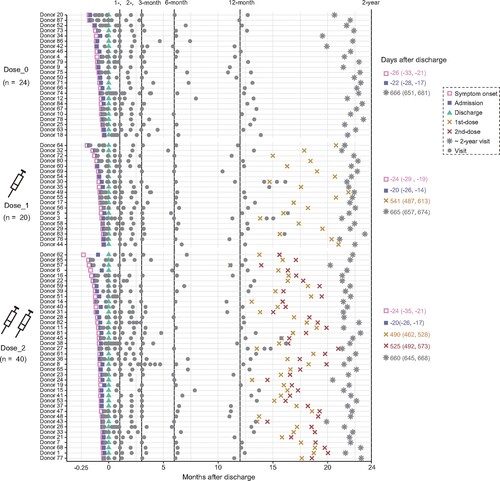
Figure 2. Longitudinal dynamics of plasma IgG, IgM, and IgA specifically binding to the WT SARS-CoV-2 RBD. (A) Kinetic of RBD-specific plasma IgG, IgM, and IgA from admission to 2 years post-discharge in 84 convalescent individuals grouped by the dose of inactivated vaccination. The level of plasma antibody is shown as a cut-off index (COI), and the value ≥1 is considered positive. (B) Comparison of the levels of anti-RBD IgG for the unvaccinated, 1-dose, and 2-dose groups at different follow-up time points. 1-month, 0–30 days after discharge (n = 72); 2-month, 50–70 days after discharge (n = 64); 3-month, 80–100 days after discharge (n = 55); 6-month, 120–240 days after discharge (n = 64); 12-month, 310–440 days after discharge (n = 78); 2-year, 580–720 days after discharge (n = 84). The number of samples for each group at each time point was labelled at the bottom. The geometric mean, fold-change, and significance of difference were labelled on the top. “−” represents decreased antibody level, and “+” represents increased antibody level. (C) The typical display of SARS-CoV-2-RBD-specific MBCs (CD19+CD3−CD8−CD14−CD27+IgG+RBD+) of one representative donor from each group. (D) The percentage of RBD-specific MBCs of 9 randomly selected donors in each of the non-vaccinated healthy donors, Dose_0, Dose_1, and Dose_2 groups. Geometric mean percentage and significance of difference were labelled on the top. Statistical analysis was performed using the two-tailed Kruskal-Wallis test with Dunn’s multiple-comparison test. ****P < 0.0001; **P < 0.01; *P < 0.05.
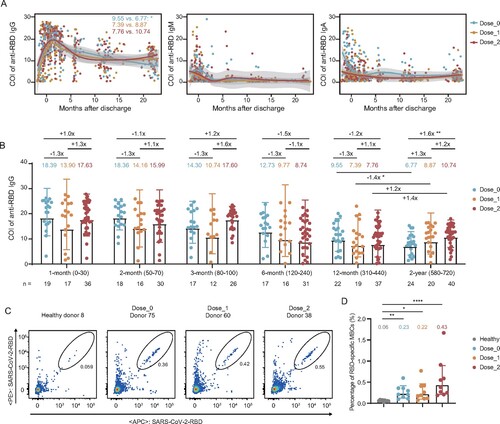
Figure 3. Effect of inactivated vaccination on the neutralizing antibody response among convalescents at the 2-year follow-up time point. (A) Percentage changes of positive plasma against WT SARS-CoV-2, Delta, and Omicron (BA.1, BA.2, and BA.4/5) variants. (B) The broad spectrum of plasma nAbs in unvaccinated (n = 24), 1-dose (n = 20), and 2-dose groups (n = 40). (C) Comparison of plasma neutralizing activities among different groups against WT SARS-CoV-2 and variants. The geometric mean, fold-change, and significance of difference were labelled on the top. “−” represents decreased neutralization activity, and “+” represents increased antibody level. Statistical analysis was performed using the two-tailed paired Wilcoxon test in (B) and the two-tailed Kruskal-Wallis test with Dunn’s multiple-comparison test in (C). ****P < 0.0001; **P < 0.01; *P < 0.05. The limit of detection was 1:30 dilution. ID50 indicates 50% inhibition dilution. The ID50 values are means of at least two independent experiments.
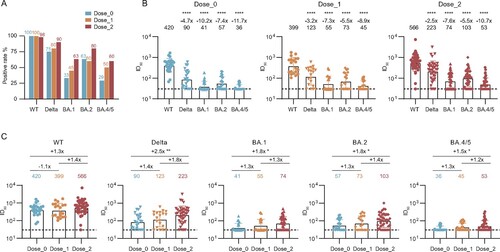
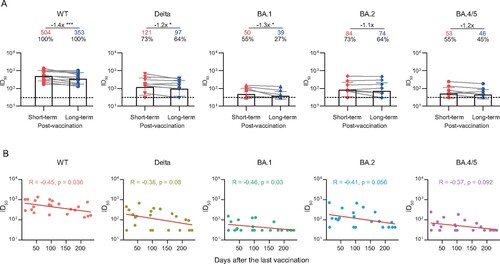
Figure 4. Durability of the broad nAbs post the last vaccination. (A) Paired plasma samples were collected from 11 individuals between the last vaccination and the 2-year follow-up visit, and then tested for neutralizing activities against WT SARS-CoV-2 and variants. The short-term and long-term post-vaccination plasma samples were collected at a median of 42 days (IQR: 28–74) and 180 days (IQR: 140–217) after the last vaccination, respectively. The positive rate, geometric mean, fold-change, and significance of difference were labelled on the top. “−” represents decreased neutralization activity. Statistical significance was determined using two-tailed paired Wilcoxon test. ***P < 0.001; *P < 0.05. The limit of detection was 1:30 dilution. ID50 indicates 50% inhibition dilution. (B) Correlation analysis between ID50 values against WT SARS-CoV-2 and variants and the days after the last vaccination. Perfect-fit correlation line was included on the plot. The non-parametric Spearman’s correlation coefficients (R) and statistically significant P value (p) were provided. The ID50 values are means of at least two independent experiments.
Supplemental Material
Download Zip (7.2 MB)Data availability statement
We are happy to share reagents and information in this study upon request.