
Figures & data
Table 1. The information of public Rickettsia species (retrieved from NCBI).
Figure 1. Morphological and biochemical characterization of Rickettsia heilongjiangensis strain B8. (A) Diff-Quick stained smears of Vero cells showed Rickettsia-like bacilli in the cytoplasm. The black arrow points to an individual bacterium. (B) Immunofluorescence microscopy of B8-infected Vero cells. DAPI (blue) was used to stain host cell nucleus; polyclonal anti-ompB antibody followed by Cy3 conjugated secondary antibody (red) was used to stain B8. (C) Scanning electron microscope (SEM) micrograph showing numerous Rickettsia-like organisms parasitizing in the cytoplasm of infected Vero cells.
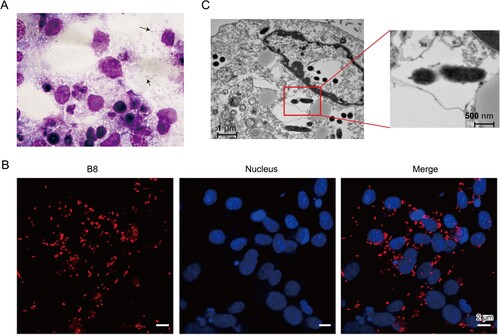
Figure 2. Genome structures and phylogenetic relatedness of B8. (A) Phylogenetic tree (Neighbour-joining) construction based on the concatenated multiple-sequence alignment (MSA) of four representative genes (gltA, groEL, 17-kD, and 16S rDNA). B8 highlighted in red was clustered with five other R. heilongjiangensis strains with green background. (B) Circular genome maps of B8. The four circles (outer to inner) show the following. Circle 1 and 2 exhibit CDS on the forward and reverse strands, as well as rRNA, tRNA, and assembly gap. Circle 3 represents the GC skew ((C − G)/(C + G)) curve (positive GC skew, dark green; negative GC skew, violet). Circle 4 shows the GC content.
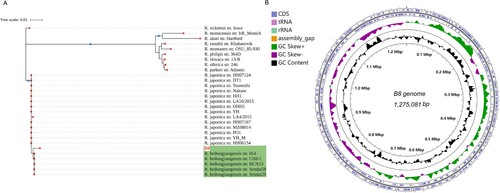
Figure 3. Heat-map of Average Nucleotide identity (ANI) values amongst different lineages representative strains of SFGR and B8. The bar in the head of heat-map shows the size of genome.
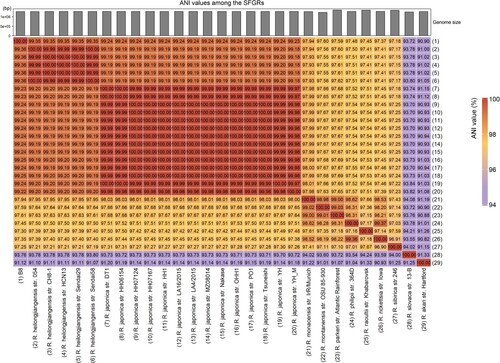
Figure 4. Functional category analysis of the B8 genome annotated to the COG, GO, and KEGG databases. (A) COG annotation assignments. The COG functional annotations were divided into 26 categories. The COG categories are shown on the X-axis as alphabets, with category names on the right. (B) GO annotation distribution (level 2). The GO assignments were divided into three categories (level 1) namely, biological process (red), cellular process (blue), and molecular function (green). (C) KEGG annotation distribution. The KEGG orthologies were categorized into eight major categories: Brite Hierarchchies, Metabolism, Genetic Information Processing, Environmental Information Processing, Human Diseases, Not Included in Pathway or Brite, Cellular Processes and Organismal Systems.
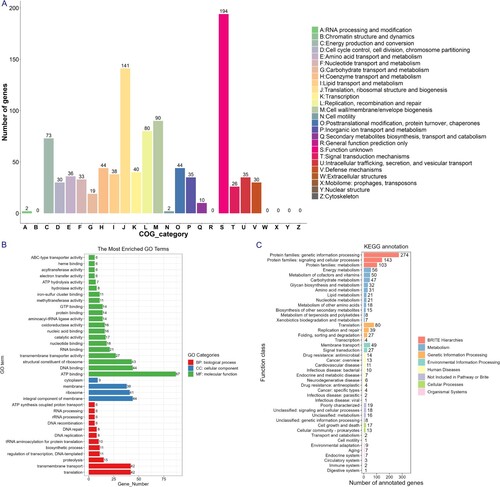
Figure 5. Analyses of ompA gene variations among B8, other 5 R. heilongjiangensis and 2 R. japonica strains. (A) Phylogenetic analysis of ompA, constructed by the neighbour-joining method in MEGA 10.0 software, and identification of conserved motif by MEME online tool. The tree and motifs distribution were visualized by TBtools. (B) For a portion of the polymorphic sites, showing sequence variation of ompA gene in the B8 genome among the selected SFGRs. The sequences were aligned with MUSCLE algorithm and visualized with Jalview.
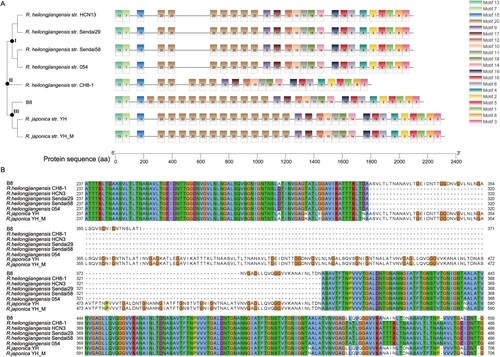
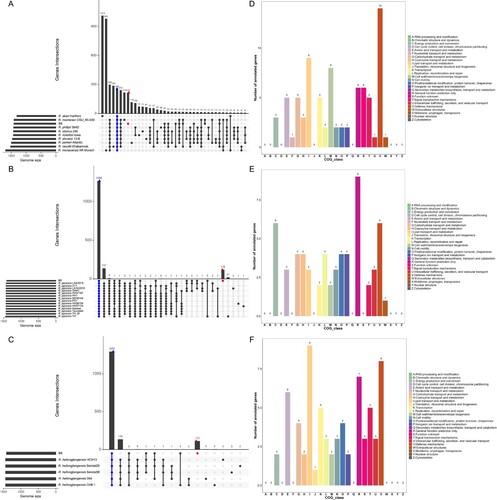
Figure 6. Genomic comparison amongst the B8 and additional SFGRs. (A–C) Upset diagram illustrating the number of core genome, shared orthologous and unique genes among B8 and 9 other SFGRs, B8 and other 14 R. japonica, as well as B8 and other 5 R. heilongjiangensis based on complete genome sequence of the selected strains in the present study. Vertical barplot indicates the number of overlapping genes (intersection size) for each intersection represented by the connected dots. The grey horizontal barplot, reported as “Gene Number,” indicate the total number of genes in each Strain. (D–F) COG annotation and categories assignment based on 216, 119, and 112 B8-unique genes.
Supplemental Material
Download Zip (4.6 MB)Data Availability Statement
The complete genome sequence of Rickettsia heilongjiangensis strain B8 was deposited at the NCBI’s GenBank with the accession ID: CP112971.