Figures & data
Figure 1. Damage caused to the global poultry industry since 2005 by different H5 avian influenza viruses based on information reported in the OIE-World Animal Health Information System. The number of poultry that died or were destroyed during outbreaks caused by different subtypes of H5 influenza viruses (a, c) in different continents (b), and (d) the number of poultry that died or were destroyed in different countries or regions since 2020. *, fewer than 10,000 birds died or were destroyed in the indicated country or regions.
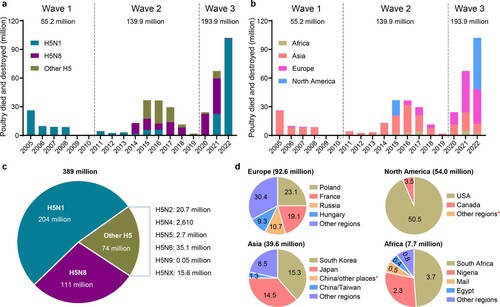
Table 1. Outbreaks caused by H7 highly pathogenic avian influenza viruses between January 2005 and November 2022 around the world.
Table 2. Human infections caused by H5 viruses around the world from January 2003 to April 2022*.
Table 3. Human infections caused by H7 viruses around the world since 1959.
Figure 2. Formation of the index H5N1 virus bearing the 2.3.4.4b HA gene in 2020. The eight bars represent the eight gene segments (from top to bottom: PB2, PB1, PA, HA, NP, NA, M, and NS), and the colour of the bar indicates the closest donor strain of the gene segment.
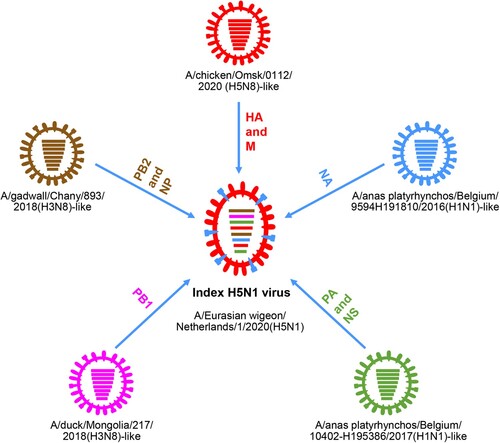
Figure 3. Spatiotemporal spread of H5N1 viruses bearing the clade 2.3.4.4b HA gene. (a) Genotype and distribution of 233 H5N1 viruses isolated from 28 countries between October 2020 and March 2022. (b–d). Emergence and spread of the indicated seven genotypes that were detected in more than one country/region/continent.
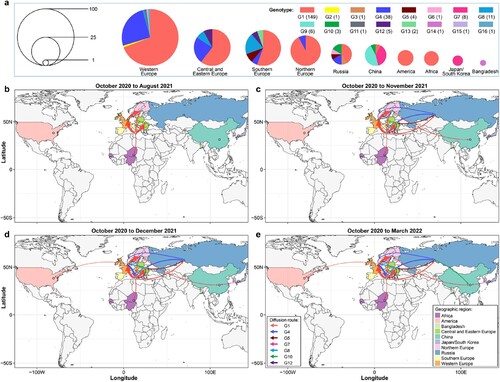
Table 4. Inactivated vaccine seed viruses generated by reverse genetics for the control of highly pathogenic avian influenza in China since 2004Table Footnotea.
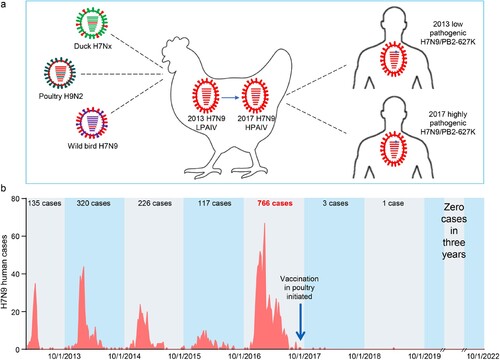
Figure 4. H7N9 viruses detected in China and the human infections they have caused since 2013. (a) Diagram of the emergence and evolution of H7N9 viruses in China. LPAIV, low pathogenic avian influenza virus; HPAIV, highly pathogenic avian influenza virus. (b) Human infections with H7N9 viruses in China.