Figures & data
Figure 1. Study profile. Ad5-nCoV = orally administered aerosolised adenovirus type-5 vector-based COVID-19 vaccine carrying full-length SARS-CoV-2 spike gene. CoronaVac = intramuscularly administered inactivated whole-virion SARS-CoV-2 vaccine.
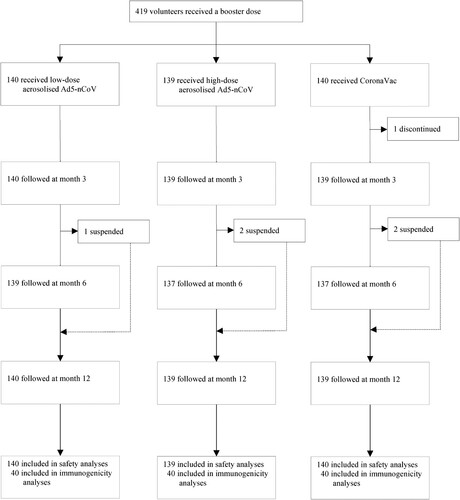
Figure 2. NAbs against live wild-type SARS-CoV-2 and omicron BA.1 subvariant after a booster vaccination. Horizontal bars show GMTs and error bars show 95% confidence intervals. Data (folds) above the bars are the NAb GMT ratios of the homologous boost group to the heterologous boost group. Long lines connecting the GMTs of adjacent groups indicate trends in NAbs over days after a booster vaccination. Data (%) above the bars show the percent reduction in GMTs of NAb titres at day 90, day 180 and day 360 post-boost compared to day 28. All horizontal dotted lines denote the cutoff levels for positivity (1:8) or the levels of WHO international standard (NIBSC code 20/136). Data below the cutoff level were assigned half the limit. GMT = geometric mean titre in serum. NAb = neutralizing antibody.
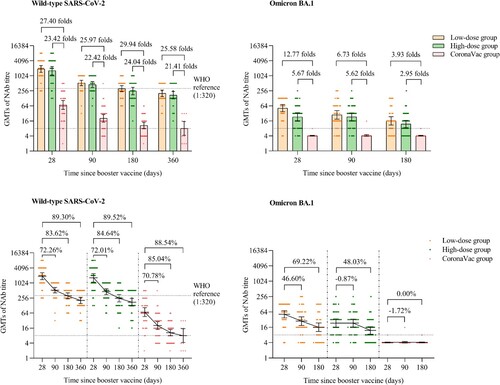
Figure 3. Neutralizing antibodies against omicron BA.4/5 pseudovirus after a booster vaccination. Horizontal bars show GMTs and error bars show 95% confidence intervals. Data (folds) above the bars are the NAb GMT ratios of the homologous boost group to the heterologous boost group. Long lines connecting the GMTs of adjacent groups indicate trends in neutralizing antibodies over days after a booster vaccination. Data (%) above the bars show the percent reduction in GMTs of NAb titres at day 90, day 180 and day 360 post-boost compared to day 28. All horizontal dotted lines denote the cutoff levels for positivity (1:30). Data below the cutoff level were assigned half the limit. GMT = geometric mean titre in serum. NAb = neutralizing antibody.
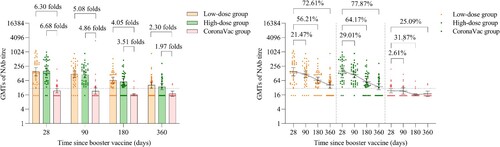
Table 1. GMT, seropositivity rate, and GMT ratio of neutralizing antibodies to omicron BA.4/5 subvariant pseudovirus after a booster vaccination.
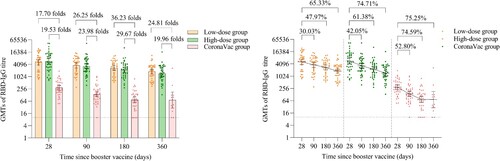
Figure 4. Wild-type SARS-CoV-2 RBD-specific IgG antibodies after a booster vaccination. Horizontal bars show GMTs and error bars show 95% confidence intervals. Data (folds) above the bars are the NAb GMT ratios of the homologous boost group to the heterologous boost group. Long lines connecting the GMTs of adjacent groups indicate trends in RBD-IgG antibodies over days after a booster vaccination. Data (%) above the bars show the percent reduction in GMTs of RBD-IgG antibody titres at day 90, day 180 and day 360 post-boost compared to day 28. All horizontal dotted lines denote the detectable cutoff titres of 1:10. GMT = geometric mean titre in serum. RBD-IgG = receptor-binding domain (RBD)-specific IgG antibodies.