Figures & data
Figure 1. USUV and WNV differentially impact the human BBB integrity in vitro. (a) The human in vitro BBB model used in this study is composed of brain pericytes (basolateral compartment) allowing the differentiation of CD34+-derived endothelial cells towards hBLEC on transwell filters (apical compartment). (b) After 2 h infection of hBLECs (MOI of 0.1, inoculum represented on Y axis), cell were rinsed and refilled with fresh medium, supernatants from apical and basolateral compartments were collected at 6 and 12 h post-infection, then at 1, 2, 4, 7 and 10 dpi; USUV (blue dots) and WNV (orange dots) replication was determined using the TCID50 method. Results are expressed as mean ± SEM (n = 12, from six independent experiments). (c) At 7 dpi, mRNA of mock, USUV or WNV-infected (MOI of 0.1) hBLECs were collected. The expression of tight junction factors and transporters were normalized to housekeeping gene HPRT1 and compared to mock-infected hBLECs (CTL) in the context of USUV (blue bar chart) and WNV (orange bar chart) infection. Results are expressed as mean ± SEM (n = 6; * p < 0.05, ** p < 0.01, from three independent experiments). (d) Infected- or mock-infected hBLECs (MOI of 0.1) were fixed after 10 dpi and indirect immunofluorescence assays performed to show hBLECs structure with actin (green), viral replication with pan-flavivirus (magenta), junctions with β-catenin labelling (cyan) and nuclei with Hoescht (blue). Scale bar 10 µm. (e) The permeability coefficient (Pe) was measured using the Lucifer Yellow transport assay at 10 dpi with USUV at MOI 0.1 (blue), USUV MOI 1 (dark blue), WNV MOI 0.1 (orange), WNV MOI 1 (dark orange) and mock-infected CTL (black). Bars represent mean ± SEM (n = 6; * p < 0.05, ** p < 0.01, from three independent experiments).
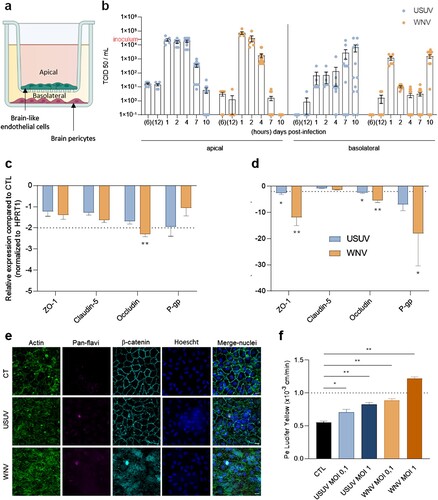
Figure 2. Characterization of innate immune response and CAMs regulation in USUV- and WNV-infected hBLECs. a, b After infection of hBLECs (MOI of 0.1), mRNAs were collected at 4 (a) or at 7 dpi (b). Gene expression was normalized to HPRT1 and compared to mock-infected hBLECs (CTL) in the context of USUV (blue bar chart) and WNV (orange bar chart) infection. Transcripts of a panel of genes were quantified by RT-qPCR. Data of each indicated transcript are represented as mean ± SEM, relative to mock-infected cells (n = 6; * p < 0.05, ** p < 0.01, from three independent experiments). c, d, e and f Supernatants from apical (c and d) or basolateral (e and f) compartments were collected at 7 dpi and secreted molecules were measured using a multiplexed ELISA assay. Concentrations of cytokines and interferons (c and e) or of chemokines, attractant growth factors and CAMs (d and f) for mock-CTL (black dots), USUV (blue dots) and WNV (orange dots)-infected conditions are represented, bars show mean ± SEM (n = 6; * p < 0.05, ** p < 0.01, from three independent experiments). g, h and i After infection of hBLECs (MOI of 0.1), mRNAs were collected at 7 dpi. Gene expression of α-integrins (g), β-integrins (h), CAMs and selectins (i) were normalized to RPL13A and compared to mock-infected hBLECs in the context of USUV (blue bar chart) and WNV (orange bar chart) infections. Results are expressed as mean ± SEM (n = 6; * p < 0.05, ** p < 0.01, from three independent experiments).
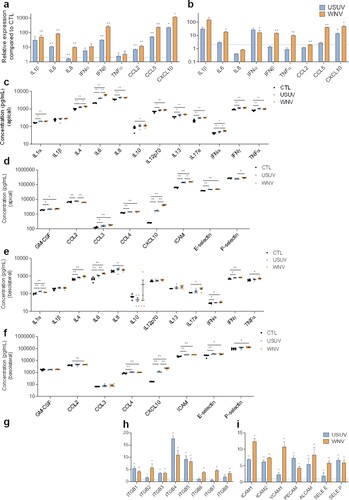
Figure 3. USUV and WNV infection induce different systemic and neuro-inflammation in vivo a Mice sera were collected at 2 or 3 dpi and inflammatory molecules were measured using a multiplexed ELISA assay. Concentrations of cytokines, IFNs, attractant growth factors and chemokines from mock-infected (CTL, black dots, n = 15), USUV (blue dots, n = 18) and WNV (orange dots, n = 14) are represented, bars show mean ± SEM (* p < 0.05, ** p < 0.01, *** p < 0.001, **** p < 0.0001). b, c, and d After ip infection of Ifnar-/- mice, brain mRNAs were extracted and purified. Gene expression of anti-viral and pro-inflammatory (b), cell adhesion (c) or tight junction (d) molecules were normalized to GAPDH and compared to control mice brain (CTL) in the context of USUV (blue bar chart) and WNV (orange bar chart) infection. Results are expressed as mean ± SEM (n = 6; * p < 0.05, ** p < 0.01).
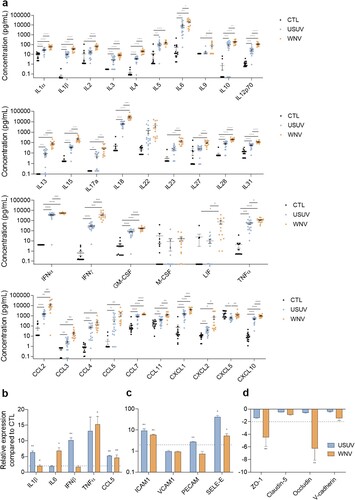
Figure 4. The inflammatory environment of infected-BBB modulates molecular and functional human primary immune cell phenotype a Apical supernatants of mock-, USUV- or WNV-infected hBLECs were collected 7 dpi, and, after viral inactivation by heating at 56°C, incubated for 48 h with monocytes . Cells were analysed by flow cytometry for characteristic membrane factors. b Integrated mean fluorescence intensity (iMFI) of DC-SIGN, HLA-DR, CD80, CD83 ICAM, VCAM and E-selectin, on monocyte from three independent experiments are represented as box and whiskers with median ± min to max. Statistical significance (p value) was determined by Student’s t test. (*p < 0.05; **p < 0.01; ***p < 0.001, ****p < 0.0001).
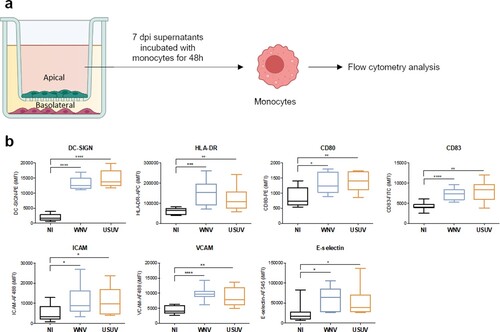
Figure 5. The infected BBB can recruit T cells, monocytes and MoDCs. a, b and c After 7 dpi of hBLECs, CFSE labelled-T cells (a), monocytes (b) or MoDCs (c) were incubated on the apical side of infected-hBLECs during 30 min (for each condition, six independent experiments were analysed from two independent hBLEC infection experiments), cells were rinsed and fixed to analyse number of immune cells bound. Indirect immunofluorescence images show immune cells (LyT, monocytes and MoDCs, in green) and hBLECs nucleus (magenta). Scale bar 50 µm. Box plots represent quantitative analyses of immune cell per field (20x) in CTL, USUV or WNV-infected hBBB (**** p < 0.0001). d CFSE-labelled MoDCs show cell spreading on infected-hBLECs (ZO-1, cyan; nucleus, blue). Scale bar 10 µm. e On WNV-infected BBB (pan-flavivirus in magenta), MoDCs (green) bind to hBLECs (β-catenin, cyan; nucleus, blue) and are displaying change in morphology consistent with cell spreading. Scale bar 10 µm.
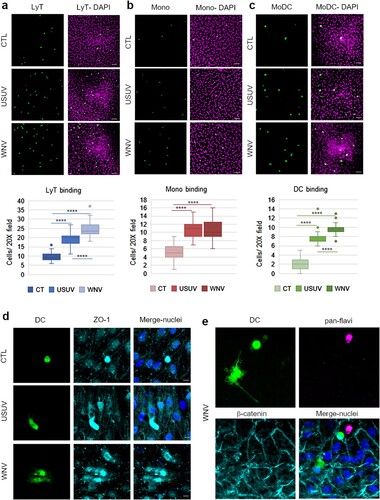
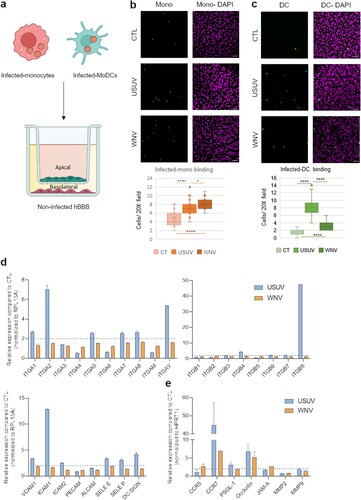
Figure 6. Infected-monocytes and DCs interact with the human BBB. a Monocytes and MoDCs were infected with USUV or WNV at MOI 0.1 for 48 h and CFSE-labelled before being added on hBLECs for 30 min (for each condition, three independent experiments were analysed). hBLECs were rinsed, fixed, and analysed by microscopy. b and c CFSE labelled- and infected-monocytes (b) or MoDCs (c) were incubated on hBLECs. Indirect immunofluorescence images show immune cells (in green) and hBLECs nucleus (magenta). Scale bar 50 µm. Box plots represent quantitative analyses of CTL, USUV or WNV-infected monocyte numbers per field (20x) (*p < 0.05, **** p < 0.0001). d After 48 h of infection, MoDC mRNA were extracted. Gene expression was normalized to RPL13A and compared to mock-infected MoDCs (CTL) in the context of USUV (blue bar chart) and WNV (orange bar chart) infection. Results are expressed as mean ± SEM (n = 6, from three independent experiments). e After 48 h of infection, MoDC mRNA was extracted. Gene expression was normalized to GAPDH and compared to mock-infected MoDCs (CTL) in the context of USUV (blue bar chart) and WNV (orange bar chart) infection. Results are expressed as mean ± SEM (n = 6, from three independent experiments).