Figures & data
Figure 1. Schematic illustrating the principal of this study. A nonsense mutation PTC-containing virus was engineered and rescued by ACE-tRNAs. ACE-tRNAs are recognized by an endogenous aminoacyl-tRNA synthetase charged with their cognate amino acid. Aminoacylated ACE-tRNA is recognized by endogenous elongation factor 1-alpha (EF1α) and delivers the aminoacyl ACE-tRNA to the ribosome for PTC read-through, achieving PTC-harbouring virus rescue (right panel). In the absence of ACE-tRNAs, PTCs are recognized by eukaryotic release factor (eRF), and polypeptide elongation is terminated (left panel).
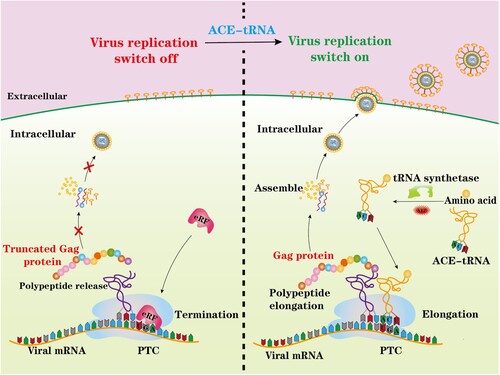
Figure 2. ACE-tRNA manifested potent PTC read-through activity. (a) Arg-tRNAUGA and (b) Gly-tRNAUGA were cotransfected with the indicated PTC EGFP in HEK293T cells. At 48 h posttransfection, fluorescence microscopy was used to evaluate the ACE-tRNA suppression efficacy. The wild-type EGFP group was used as a positive control, and the nontransfected group was used as a negative control. Cell nuclei were stained with DAPI; the scale bar represents 200 μm. (c) Heatmap of the EGFP of PTC suppression efficacy mediated by the three ACE-tRNAs. The MFI of EGFP was evaluated using flow cytometry. The nontransfected group was used as a mock control, and the pDC315-EGFP PTC plasmid and ACE-tRNA empty vector pUC57 cotransfected groups were used as negative controls. Experiments were repeated three times, and the mean MFI is presented. (d) Detection of the mRNA levels of PTC-EGFP mutants using RT–qPCR. Experiments were repeated three times.
Figure 3. Comparison of the read-through efficacy of PTC sites using GCE and ACE-tRNA technology. (a) Arg-tRNAUGA, Gly-tRNAUGA or control vector pUC57 was cotransfected with PTC-EGFP-Lys mutants or (b) PTC-EGFP-Gly mutants. The EGFP-WT-transfected group was used as a positive control, and the mock-transfected group was used as a negative control (upper panel). The EGFP-WT or PTC-EGFP plasmid was cotransfected with the MbPylRS/tRNACUA plasmid into HEK-293T cells. Two parallel experiments were conducted. Cell culture medium was replaced with fresh medium supplemented with 2% FBS with or without 1 mM UAA (NAEK) at 6 h posttransfection (lower panel). Fluorescence microscopy was used to compare the read-through efficacy of GCE and ACE-tRNA technology. (c) Heatmap of the PTC-EGFP read-through efficacy mediated by GCE and ACE-tRNA technology. The MFI of EGFP was evaluated using FACS. Experiments were repeated three times.
Figure 4. Anti-codon editing of the orthogonal tRNA used in GCE technology. (a) Schematic diagram of the anticodon editing of the orthogonal tRNA used in GCE technology. (b) and (c) The read-through efficacy of two sets of GCE systems containing tRNACUA and tRNAUCA were compared. The pDC315-EGFP-TAG mutant and MbpylRS/tRNACUA pair were cotransfected into HEK-293T cells, and the pDC315-EGFP-TGA mutant and MbpylRS/tRNAUCA were cotransfected into HEK-293T cells. Forty-eight hours after transfection, fluorescence microscopy was used to analyse the read-through efficacy of PTCs harbouring GFP mutants by two sets of GCE systems in the presence or absence of UAA. (d) Heatmap of the PTC read-through efficacy mediated by the two GCE systems. The MFI of EGFP was evaluated using FACS. Experiments were repeated three times, and the mean MFI is presented.
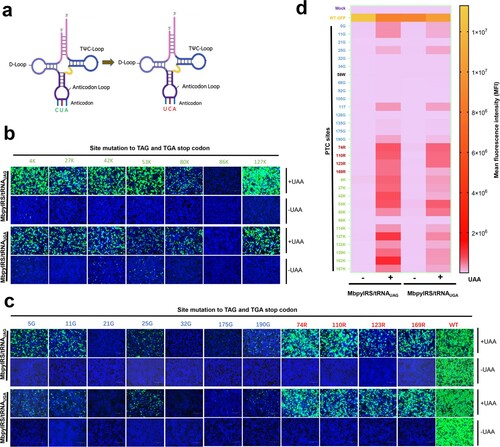
Figure 5. ACE-tRNAs as a precise switch for HIV-1 pseudotyped virus production. (a) Schematic diagram of the gene distribution of psPAPX2. The blue element is CMV (cytomegalovirus promoter), yellow and grey represent the HIV gag and Pol genes, respectively, and the p17 and p24 genes are indicated in the gag gene represented in green and light grey. The PTC sites were located between SphI and SpeI in p24. The numbers above the diagram represent the corresponding position in the gag protein, and the numbers below the diagram represent the corresponding position in p24. (b) Crystal structure of the HIV CA pentamer; the green part inside the box is the capsid protein p24. Amino acid codons selected for replacement with TGA are labelled within the tertiary structure of p24. (c) psPAPX2 or the indicated PTC constructs of psPAPX2, pMD2.G, PLVX-IRES-ZSGreen and the indicated ACE-tRNA or control vector were cotransfected into HEK293T cells to package the EGFP reporter virus. At 48 h posttransfection, 200 μL of collected virus were used to infect HEK293T cells. Fluorescence was observed at 48 h postinfection (hpi). An untransfected group was used as a mock control. Cell nuclei were stained with DAPI; scale bar 200 μm. (d) The MFI of infected HEK293T cells was evaluated using flow cytometry. (e) Firefly luciferase assay of ACE-tRNAs in the production of luciferase reporter PTC-containing virus. Two hundred microliters of collected virus were used to infect HEK293T cells, and the cells were washed and lysed for luciferase activity detection at 48 hpi. Experiments were repeated at least three times. Error bars represent the standard deviations (SD). (f) Western blot detection of PTC-harbouring virus production with the control vector, (g) Arg-tRNAUGA or (h) Gly-tRNAUGA. Experiments were repeated at least three times, and a representative result is shown.
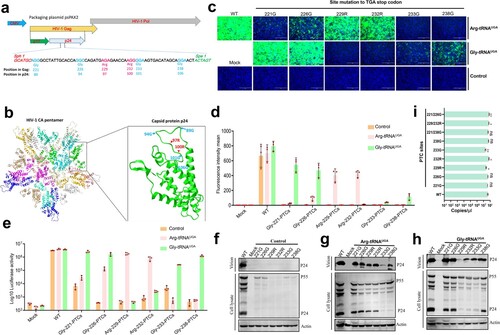
Figure 6. ACE-tRNAs as a precise switch for PRV-PTC replication. (a) A cell-to-cell fusion assay was used to evaluate the read-through efficiency of PTC-harbouring gB mutants by Arg-tRNAUGA or (b) Gly-tRNAUGA. A total of 150 ng (each) of plasmids encoding gB or its mutants, gD, gH, gL, pDC315-EGFP and 400 ng of the indicated ACE-tRNA were cotransfected into RK13 cells growing in 24-well plates. In parallel, transfection of the ACE-tRNA empty vector pUC57 with these plasmids was performed in each group as a control. Fluorescence microscopy was used to analyse the read-through efficacy with the indicated gB-mediated cell fusion analysis 48 h after transfection. The wild-type gB-transfected group served as the positive control, and the nontransfected group served as the mock control. Nuclei were stained with DAPI, scale bar = 200 μm. (c) The corresponding position of PTC sites with good fusion and expression effects in the gB crystal structure. (d) Rescue of PRV-PTC virus in HEK-293T cells. pPRV-Arg-151-PTC and pPRV-Arg-196-PTC were cotransfected with 2 µg of Arg-tRNAUGA or pUC57 plasmid into cells. The 2 µg pPRV-Bac transfection group was used as a positive control, and the untransfected group was used as a mock control. At 48 hpi, the CPE phenotype was observed using fluorescence microscopy. (e) Electron microscopy was used to observe the morphology of PRV-PTC and PRV-WT. Scale bar = 50 nm. (f) The TCID50 was calculated to determine the titre of PRV-PTC rescued at different time points. Experiments were repeated at least three times. Error bars represent the SD. (g) Verification of the genetic stability of progeny PTC-harbouring viruses by passaging in HEK-293T cells expressing Arg-tRNAUGA or the control cells.
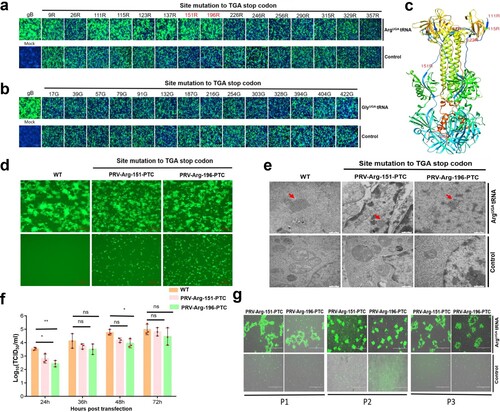
Figure 7. Characterization of the safety of PRV-PTC in vivo. (a) Percent survival of mice inoculated with different agents (n = 7) over 21 days. (b) H&E staining of the brains of the mice in different groups. Yellow arrows indicate representative abnormal areas, scale bars, 50 μm (magnified images of H&E staining), and the top right insets show full images, scale bars, 100 μm.
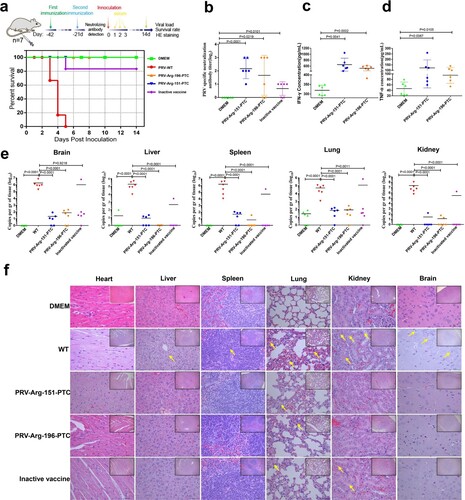
Figure 8. Characterization of the immunogenicity of PRV-PTC in vivo. (a) Percent survival of immunized mice after challenge with a lethal dose of the PRV strain JS2012 (n = 6). (b) PRV-specific neutralizing antibody titres in serum. Sera were collected from two immunized BALB/c mice 1 d before challenge with the PRV JS2012 strain (n = 6). Bars indicate SD. (c) Serum IFN-γ and (d) TNF-α levels. Serum was obtained from mice immunized two times with the indicated viruses 1 d after the challenge infection (n = 6). The serum was tested for the levels of IFN-γ and TNF-α using ELISA. The values are presented in pg IFN-γ per mL, and the bars indicate standard deviations. (e) Viral loads in the heart, liver, spleen, lung, kidney and brain of each group (n = 6). The mice were dissected at 14 dpi to collect these tissues. After homogenization, the tissue samples were used for DNA extraction and RT–qPCR. The values are presented in virus copies per gram, and the mean values are indicated. (f) H&E staining of hearts, livers, spleens, lungs, kidneys and brains of the mice in different groups after dissection at 14 dpi. Yellow arrows indicate representative abnormal areas. Scale bars, 50 μm (magnified images of H&E staining), and the top right insets show full images, scale bars, 100 μm.