Figures & data
Figure 1. Cross-neutralization of SARS-CoV-2 variants elicited by BA.1, BA.2, BA.2.12.1, or BA.5 infection. (A) Experimental scheme. 8- to 10-week-old K18-hACE2 mice were infected via intra nasal (i.n.) route with infectious clone derived BA.1, BA.2, BA.2.12.1 or BA.5. On day 21 post-infection, mice sera were collected and cross-neutralization against SARS-CoV-2 variants was measured by FFRNT. On day 38 post-primary infection, all mice were rechallenged with BA.5. Two days after the challenge, mice were euthanized, and tissue viral loads were quantified. (B) Mouse body weight after primary infection. Daily body weight was normalized to the initial body weight. Data are presented as mean ± standard deviation (SD). (C) Lung viral loads after day 2 post-infection. (D) Trachea viral loads after day 2 post-infection. (E) FFRNT50s of BA.1-infected mouse sera. The dashed line indicates the limit of detection (1:20 dilution). The bar heights and the numbers above indicate geometric means of neutralizing titres (GMT). The whiskers indicate 95% CI. The Wilcoxon matched-pairs signed-rank test was performed for group comparison of GMTs. The p values between GMTs against BA.1-spike and USA-WA1/2020, Delta-spike, BA.2-spike, BA.2.12.1-spike, BA.4.6-spike and BA.5-spike are 0.002, 0.002, 0.082, 0.30, 0.049, 0.065, respectively. (F) FFRNT50s of BA.2-infected mouse sera. The p values between GMTs against BA.2-spike and USA-WA1/2020, Delta-spike, BA.1-spike, BA.2.12.1-spike, BA.4.6-spike and BA.5-spike are 0.002, 0.002, 0.002, 0.10, 0.002, 0.002, respectively. (G) FFRNT50s of BA.2.12.1-infected mouse sera. The p values between GMTs against BA.2.12.1-spike and USA-WA1/2020, Delta-spike, BA.1-spike, BA.2-spike, BA.4.6-spike and BA.5-spike are 0.004, 0.004, 0.008, 0.63, 0.016, 0.008, respectively. (H) FFRNT50s of BA.5-infected mouse sera. The p values between GMTs against BA.5-spike and USA-WA1/2020, Delta-spike, BA.1-spike, BA.2-spike, BA.2.12.1-spike, and BA.4.6-spike are 0.001, 0.001, 0.001, 0.004, 0.008, 0.84, respectively. (I) Lung viral loads at day 2 post-challenge. (J) Trachea viral loads at day 2 post-challenge. (K) Viral RNA in the lung on day 2 post-challenge. (L) Viral RNA in nasal turbinates at day 2 post-challenge. The dashed line in (K-L) shows the cutoff as determined from the uninfected mouse samples. Data in (C, D, I-L) show mean ± standard deviation (SD). p values shown as italic numbers in (C, D, I-L) were calculated using one-way ANOVA with Tukey’s multiple comparisons test. p < 0.05, statistically significant.
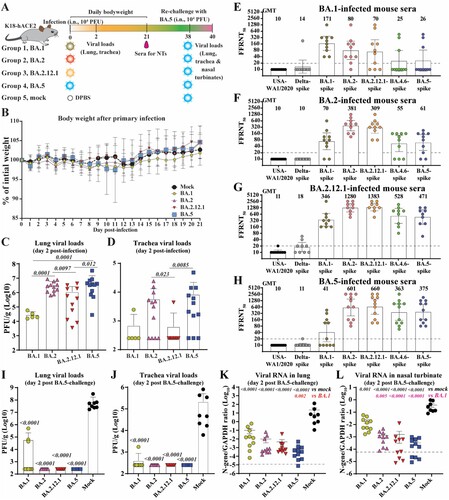
Figure 2. Competition of Omicron sublineages in HAE. (A) Diagram of competition experiment. Human airway epithelium was infected with a mixture of two viruses (equal PFU). At 24–96 h post-infection, extracellular viral RNA populations were determined by next-generation sequence (NGS). The viral RNA population in the inoculum measured by NGS was indicated as input. (B) The percentage of viral RNA in BA.1 and BA.2 infected HAE. (C) Scatter plot of the ratio of BA.2 to BA.1 RNA from infected HAE. (D) The percentage of viral RNA in BA.2 and BA.2.12.1 infected HAE. (E) Scatter plot of the ratio of BA.2.12.1 to BA.2 RNA from infected HAE. (F) The percentage of viral RNA in BA.2 and BA.5 infected HAE. (G) Scatter plot of the ratio of BA.5 to BA.2 RNA from infected HAE. (H) The percentage of viral RNA in BA.2.12.1 and BA.5 infected HAE. (I) Scatter plot of the ratio of BA.5 to BA.2.12.1 RNA from infected HAE. The mean ± standard deviations (SD) are shown in B, D, F, and H. The geometric ratio (GMR) and 95% confidence intervals (indicated as error bars) are shown in C, E, G, I. P values are calculated as the coefficient of each linear regression analysis of RNA ratio at a given time-point versus input RNA ratio.
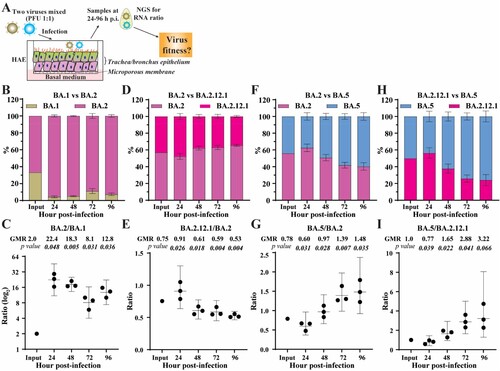
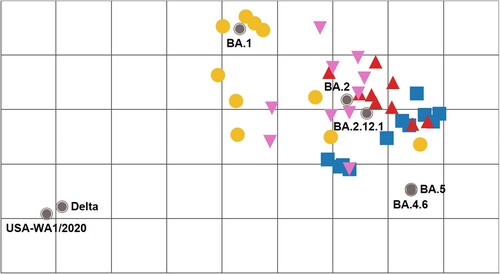
Figure 3. Antigenic cartography of SARS-CoV-2 FFRNT50 data using mouse anti-sera. The antigenic map was prepared according to serum FFRNT50 values against mNG reporter SARS-CoV-2 spike variants. The FFRNT50 values are presented in E-H. SARS-CoV-2 variants (grey, filled circle icons) are labelled by name or Pango lineage. Individual mouse antisera are colour-coded based on the viral inoculum: BA.1 (gold circles), BA.2 (pink triangles), BA.2.12.1 (red triangles), and BA.5 (blue squares). Grid increments indicate a two-fold reduction in FFRNT50 titre between two icons. Thus, two grids correspond to 4-fold dilution, three to 8-fold dilution, and so on.