
Figures & data
Figure 1. Functional characterization of BOMV proteins. (A) VLP formation induced by BOMV VP40. HEK293T cells were transfected with expression plasmids for flag-tagged EBOV or BOMV VP40 (or eGFP as a negative control). Supernatants were harvested 48 h post-transfection and analyzed via SDS-PAGE and Western blot. VP40 was detected with an anti-flag antibody. (B) Cryo-electron tomography of VLPs composed of BOMV VP40 or EBOV VP40. Longitudinal and near-to-surface slices through a tomogram of VLPs are shown. The VP40 matrix forms helically ordered linear segments underneath the inner membrane monolayer that are visible as regular striations from the top view. Scale bars: 100 nm. (C)-(D) Functionality of BOMV GP. HEK293T cells (p0 cells) were transfected with all components for a trVLP assay, including EBOV tetracistronic minigenome plasmids encoding EBOV or BOMV GP either as published for C. pumilus (GP.P554), or with a single proline to leucine exchange at amino acid position 554 (GP.L554). As a negative control the expression plasmid for L was omitted (-L). Reporter activity in p0 cells (C) was measured 72 h post-transfection, and trVLPs were harvested and used to infect p1 cells, in which reporter activity was measured 72 h post-infection (D). Means and standard deviation of 4 biological replicates from 2 independent experiments are shown. Significant differences compared to -L controls are indicated: n.s.: not significant; *: p < 0.5; ****: p < 0.0001. (E) Comparison of the amino acid sequences of the heptad repeat 1 region of GP2 from different ebolaviruses. h = hydrophobic, p = polar, c = charged. The helix-breaking proline residue specific to the published BOMV sequence from C. pumilus (MF319186) is shown in red and underlined.
Figure 2. In vitro characterization of recombinant BOMV. (A) Genome structure of recombinant BOMV. The full-length genome is shown, with genes depicted as grey boxes and open reading frames indicated as arrows. Black boxes show non-transcribed regions, and steps indicate gene overlaps. The asterisk marks the editing site in the GP gene giving rise to sGP, GP1,2 and ssGP. (B) Cryo-electron tomography of recombinant BOMV. An overview 2D projection image of BOMV distributed on an electron microscopy grid is shown, along with slices of a tomogram showing the longitudinal cross-section of the filamentous Bombali virus highlighted, and a transverse cross-section. Scale bars: 1 µm (overview), 100 nm (longitudinal cross-section), and 50 nm (transverse cross-section). (C) Growth kinetics of EBOV and BOMV. VeroE6 or A549 cells were infected with recombinant EBOV (circles) or BOMV (squares) at a multiplicity of infection of 0.01 and supernatants were harvested daily. Viral titres were analyzed by tissue culture infectious dose 50 (TCID50) assay. dpi = days post-infection. (D) Development of cytopathic effect. Infected cells from (C) were examined daily for the development of cytopathic effect. d = day.
Figure 3. In vivo characterization of recombinant BOMV in infected huNSG-A2 mice. (A) Weight loss in EBOV and BOMV infected mice. Mice were infected intranasally with EBOV (n = 5) or BOMV (n = 5), whereas mock-infected mice (n = 3) received 20 μL DMEM. Means and standard deviations for each group are shown. A nonparametric Mann-Whitney test indicated significant differences between results for mice infected with BOMV and EBOV (p = 0.0147). dpi = days post-infection. (B) Kaplan-Meier survival curves of EBOV and BOMV infected mice. A log-rank (Mantel-Cox) test indicated statistically significant differences between BOMV and EBOV-infected mice (p = 0.0350). (C) Viremia and (D) AST levels in the blood of EBOV and BOMV surviving and non-surviving mice. Individual animals are shown, with non-survivors and survivors indicated as empty circles/squares or filled circles/squares, respectively. dpi = days post-infection.
Figure 4. Organ virus and antigen loads in infected huNSG-A2 mice. (A) Viral titres in organs. VeroE6 cells were inoculated with homogenized organ samples from EBOV- or BOMV-infected huNSG-A2 mice, as indicated. Infected cells were overlaid with methylcellulose containing medium for 7 days. After fixation and permeabilization, infection foci were visualized and counted. FFU = focus forming units. (B) Immunohistochemistry of EBOV and BOMV infected mice. Fixed tissue samples from the indicated organs were sliced, processed for immunohistochemistry, and evaluated for viral antigen scoring (see Supplemental Table 1). Scores for individual animals as well as median scores are shown, with non-survivors and survivors indicated as empty circles/squares or filled circles/squares, respectively. (C) Representative tissue slices used for the evaluation of viral antigen scores. Arrows highlight viral antigen (red-brown signal), and insets show a magnification of the area. EBOV antigen was found in the liver in both hepatocytes (black arrow) and sinusoid lining cells (green arrow); in the spleen in mononuclear immune cells, where it was widespread (EBOV early) or found in scattered cells (EBOV late, green arrow); in the lung where it was abundant in interstitial mononuclear cells (EBOV early) and in perivascular interstitial mesenchymal cells (EBOV late, green arrow); in the kidney in a few stellate cells in the interstitium (green arrow); in the brain in meningeal mesenchymal cells (EBOV early, black arrow) and endothelial cells (EBOV early, green arrow) and as widespread labelling in olfactory nerve cells (EBOV late). BOMV antigen was found in the liver in periportal mesenchymal cells (BOMV survivor, black arrow) and sinusoid lining cells (green arrow); in the spleen in mononuclear cells, in single cells (BOMV early, green arrow) and subcapsular (BOMV survivor); in the lung in alveolar cells that could not be not further characterized (BOMV early, green arrow) and in interstitial immune cells or mesenchymal cells (BOMV survivor). No BOMV antigen was found in the kidney or in the brain. Scale bars indicate 50 µm.
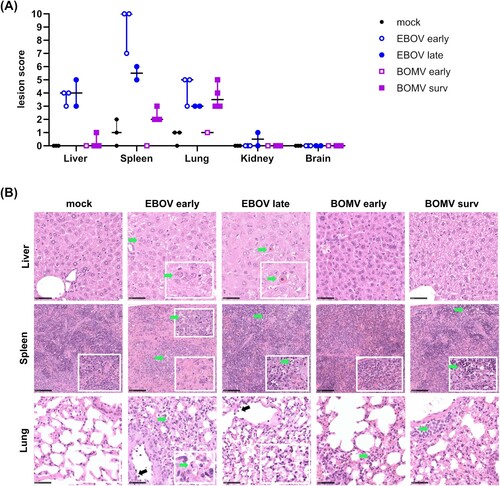
Figure 5. Histopathologic lesions in organs of EBOV and BOMV infected huNSG-A2 mice. (A) Lesion scores from tissue slices. Slices from the indicated organs of EBOV- or BOMV-infected huNSG-A2 mice were stained with hematoxylin and eosin and evaluated for histopathological changes (see Supplemental Table 2). Values for individual animals as well as median scores are shown, with non-survivors and survivors indicated as empty circles/squares or filled circles/squares, respectively. (B) Representative tissue slices used for the evaluation of lesion scores. Mock-infected mice showed no changes in the liver, spleen (lower inlay showing expected cellularity for comparison) or lung; EBOV infection was associated with the presence of cytoplasmic viral inclusion bodies (EBOV early, green arrow), and Councilman bodies (EBOV late, green arrow); in the spleen, an EBOV-induced decrease in cellularity (EBOV early, lower inlay) and apoptosis of lymphocytes in the red and white pulp with numerous tingible body macrophages (EBOV early and late, green arrow) was observed. EBOV infection also affected the lung showing diffuse septal thickening, alveolar apoptosis (green arrow), activation of the endothelium with immune cell rolling (black arrow) and interstitial, mononuclear infiltrates (EBOV late, inlay). No lesions were seen in the liver after BOMV infection; in the spleen apoptosis of lymphocytes in the red pulp with numerous tingible body macrophages (BOMV late, green arrow) was seen; in the lung BOMV infection-associated interstitial (BOMV early, green arrow) and perivascular (BOMV late, green arrow) mononuclear infiltrates were observed. Scale bars in liver and lung samples indicate 50 µm, and in spleen samples 100 µm.
Supplemental_Tables.pdf
Download PDF (199.3 KB)Supplemental_Figures.pdf
Download PDF (189.4 KB)Supplemental_Methods_v5.pdf
Download PDF (88.8 KB)Data availability statement
The authors confirm that the data supporting the findings of this study are available within the article and its supplementary materials. The sequence of the rescued Bombali virus is available in GenBank (https://www.ncbi.nlm.nih.gov/genbank) under accession number ON871047.