Figures & data
Figure 1. Multivariate data analysis of data from the metabolic profiles of porcine alveolar macrophages. (a) PCA scores of the porcine alveolar macrophage samples in positive mode. (b) OPLS-DA score plot of the porcine alveolar macrophage samples in positive mode. (c) Permutation test of control and test group in positive mode. (d) PCA scores of the porcine alveolar macrophage samples in negative mode. (e) OPLS-DA score plot of the porcine alveolar macrophage samples in negative mode. (f) Permutation test of control and test group in negative mode.
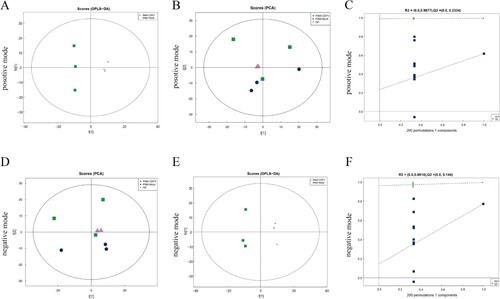
Figure 2. Statistical comparison of metabolites and analysis of differential metabolites and key metabolic pathways. Volcano plot of metabolites in porcine alveolar macrophage in positive mode (a) and negative mode (b). (c) and (d) Heatmap of the top 35 metabolites in porcine alveolar macrophage. Up-regulated and down-regulated metabolites are coloured in red and blue, respectively. (e) Pathway analysis of the key metabolites in porcine alveolar macrophage.
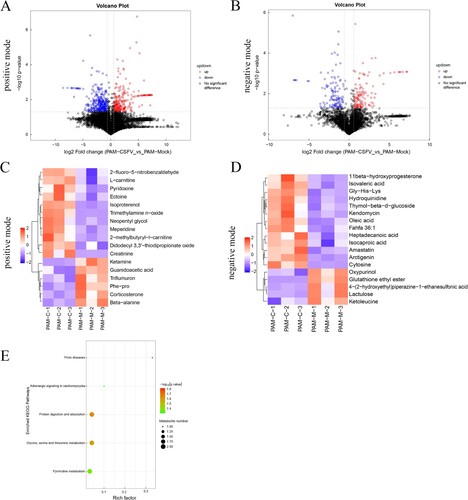
Figure 3. Global comparison of DEGs in different groups. (a) Volcano plot of genes in porcine alveolar macrophage. (b) Heatmap of differentially expressed genes between two treatment groups (c) The Go analysis result of DEGs. (d) KEGG enrichment analysis of differentially expressed genes (the most enriched top 20 pathway terms).
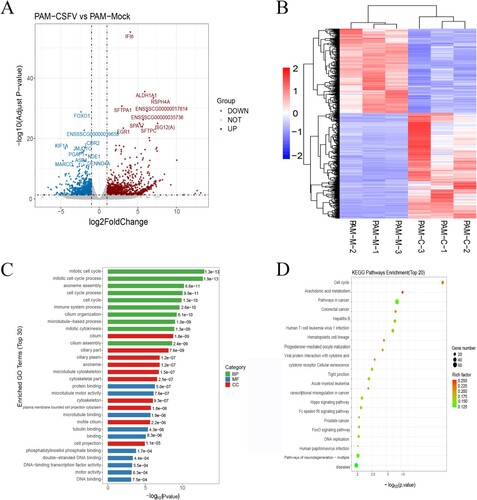
Figure 4. CSFV infection in vivo can alter innate host immunity and cell metabolism. (a) Western blot detection of p-IRF3, IRF3, RIG-I, MAVS, and ISG15 in CSFV infection in vivo. (b) Western blot detection of JAK-1, p-JAK-1, STAT-1, and p-STAT-1 in CSFV infection in vivo. (c) q-RT-PCR was used to detect the relative expression of cytokines IFN-α, IFN-β, IL-1β, TNF-α, IL-6 and IL-8 as described in Materials and Methods. Error bars indicate the mean (±SD) of 3 independent experiments. *, P < 0.05; **, P < 0.01; and ***, P < 0.001 (one-way ANOVA). (d) Western blot detection of RELA, p-RELA, NFΚBIA and p-NFΚBIA in CSFV infection in vivo. (e) Western blot detection of PARP, Caspase-3, Caspase-9, Cleaved-Caspase-3, Cleaved-Caspase-9 and Cleaved-PARP in CSFV infection in vivo. (f) Significant changes in genes that regulate metabolism were found in the transcriptome data. (g) Monitoring the extracellular acidification rate induced by CSFV infection using a fluorescence microplate reader. (h) Western blot detection of changes in glycolytic key enzymes and serine metabolism key enzymes induced by CSFV infection. (i) ELISA assays measured the plasma concentrations of lactic acid. Error bars indicate the mean (±SD) of 3 independent experiments. *, P < 0.05; **, P < 0.01; and ***, P < 0.001 (t-tests). (j) ELISA assays measured the plasma concentrations of 3-Phosphoglycerate. Error bars indicate the mean (±SD) of 3 independent experiments. *, P < 0.05; **, P < 0.01; and ***, P < 0.001 (t-tests).
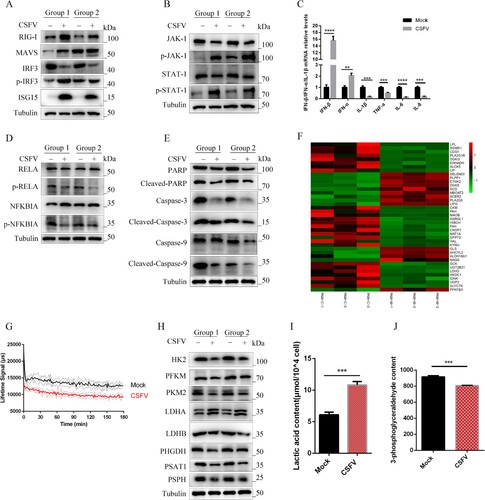
Figure 5. CSFV infection induces autophagy. (a) Significant changes in genes regulating autophagy were found in transcriptome data. (b) Western blot detection of p62, Beclin-1, ATG5, and LC3 in CSFV infection in vivo. (c) 3D4/21 cells transiently expressing LC3-mRFP-EGFP were infected with CSFV for 24 and 48 h. In the zoomed images, fluorescence signals indicated the expression of mRFP and GFP protein targeting LC3: yellow colour, no autophagy; red colour, autophagy. (d) CSFV E2 protein expression was detected using Western blot by treating cells with 3-Methyladenine, rapamycin, or siATG5. Statistical analysis of the effect of autophagy on viral titres (e) and viral genome replication (f) after 24 h of treatment of cells with 3-Methyladenine, rapamycin, or siATG5. Error bars indicate the mean (±SD) of 3 independent experiments. *, P < 0.05; **, P < 0.01; and ***, P < 0.001 (t-tests).
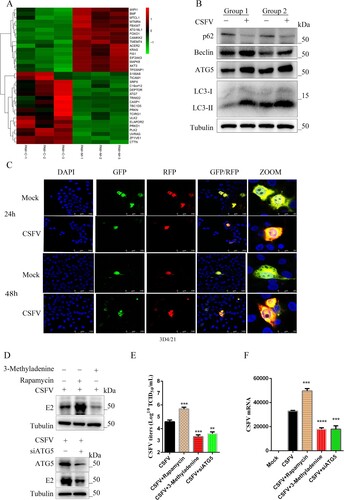
Figure 6. Autophagy regulates innate immunity induced by CSFV infection in vitro. PAMs infected with CSFV were treated with rapamycin, 3-Methyladenine, or siATG5 and incubated for 24 h (a and d). Western blot detection the effect of autophagy on the protein expression of RIG-I, MAVS, IRF3, P-IRF3, and ISG15 (b and e) Western blot detection of JAK-STAT signalling pathways. (c and f) Western blot detection of the effect of autophagy on the protein expression of RELA, p-RELA, NFΚBIA, and p-NFΚBIA. (g and h) Western blot detection the effect of autophagy on the protein expression of PARP, Caspase-3, Caspase-9, Cleaved-Caspase-3, Cleaved-Caspase-9, and Cleaved-PARP. (g) The effect of regulated autophagy on the extracellular acidification rate was examined using a fluorescent microplate reader. ELISA assays measured the plasma concentrations of ATP (i), lactic acid (k), Pyruvate (l), and 3-Phosphoglycerate (m). Error bars indicate the mean (±SD) of 3 independent experiments. *, P < 0.05; **, P < 0.01; and ***, P < 0.001 (t-tests).
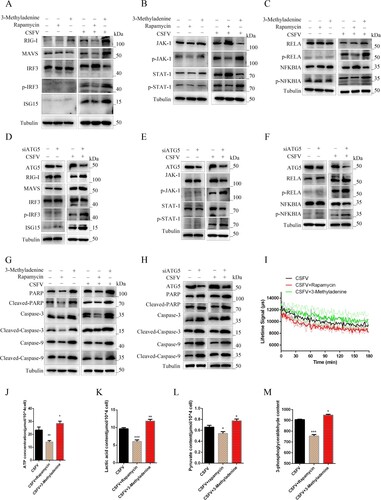
Figure 7. Silencing HK2 modulates CSFV-induced innate immunity. PAMs were transfected with siHK2 and incubated with CSFV (MOI = 0.1) for 24 and 48 h. (a) The protein levels of RIG-I, MAVS, IRF3, P-IRF3, and ISG15 were assayed. (b) The marker proteins JAK-1, p-JAK-1, STAT-1, and p-STAT-1 of JAK-STAT signalling pathways in HK2-inhibited cells were also detected by western blot. (c) The proteins RELA, p-RELA, NFΚBIA, and p-NFΚBIA in HK2-inhibited cells were also detected by western blot. (d) The proteins Cleaved-Caspase-3, Cleaved-Caspase-9, and Cleaved-PARP of apoptosis in HK2-inhibited cells were also detected by western blot.
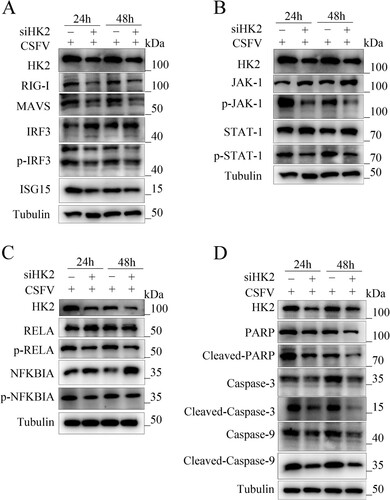
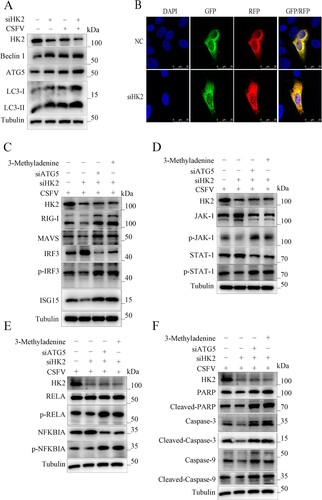
Figure 8. HK2 Regulates Innate Immunity through Autophagy. (a) Inhibition of HK2 induced autophagy as detected by the relative expression of the autophagy-associated proteins Beclin-1, ATG5and LC3. (b) 3D4/21 cells transiently expressing mRFP-GFP-LC3 plasmid were transfected with siHK2 for 24 h. Confocal fluorescence microscopy captured the yellow dots (autophagosomes) and red dots (autophagolysosomes). PK-15 and 3D4/2 cells were treated with rapamycin, 3-Methyladenine, or siATG5 for 6 h, then mock-inhibited or inhibited with the siRNA of HK2. Western blot analysis of the relative expression of the interferon signalling pathway mark proteins of p-IRF3 (c), p-JAK, and p-STAT1 (d), the NFκB signal pathway protein p-IKBIA and p-RELA (e), the apoptosis proteins of Cleaved-Caspase-3, Cleaved-Caspase-9 and Cleaved-PARP (f).