Figures & data
Table 1. Constitution in gender, age group, and specimen sources of the ST764-t002 and ST764-t1084 genotype S. aureus isolates.
Figure 1. Antibiotic resistance genes (left) and antibiotics susceptibility profiles (right) of 52 ST764 S. aureus isolates collected in this study.
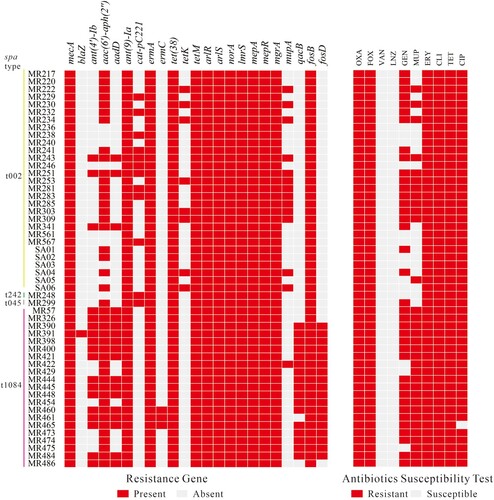
Figure 2. Virulence gene profiles of the 52 ST764 S. aureus isolates. Coloured blocks represent the presence of genes and white blocks represent absence. The horizontal colour bar (from left to right) represents genes associated with haemolysins, capsule, adhesion, PVL, secretion systems, exoenzymes, enterotoxins, and other virulence genes.
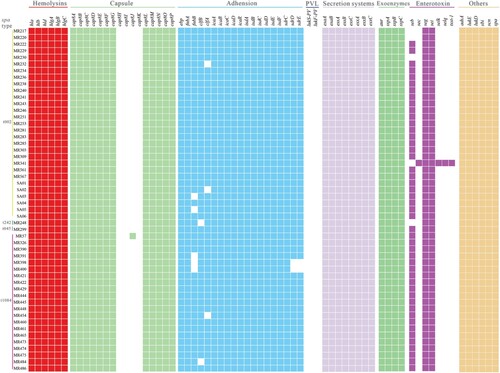
Figure 3. Phenotypic tests of the ST764 S. aureus isolates. (A) Erythrocyte lysis capacity (separated by spa types) of the 52 ST764 S. aureus isolates. (B) The transcriptional level of hla (six randomly selected isolates each in t002 isolates and t1084 isolates). Transcript levels were normalized to gyrB transcript level. S. aureus N315 was used as a control (relative expression = 1). (C) Western blot assay was used to assess the secretion of α-toxin in the twelve ST764 S. aureus isolates (randomly selected isolates as illustrated above). (D) Evaluation of grey values of the secretion α-toxin using Image J software. (E) Semi-quantitative biofilm formation ability (separated by spa types) of the 52 ST764 S. aureus isolates. (F) Cell adhesion assays in A549 lung epithelial cells of randomly selected ST764 S. aureus isolates (10 randomly selected isolates each in t002 isolates and t1084 isolates).
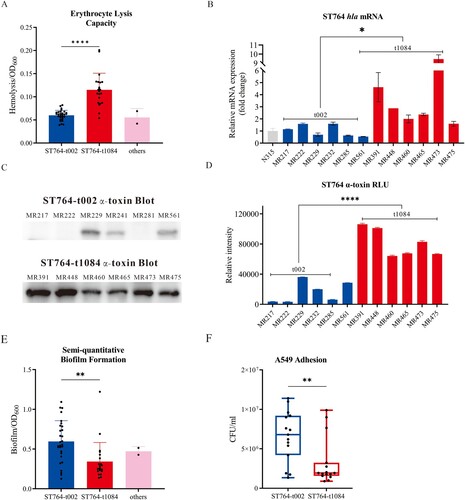
Figure 4. RT-qPCR detection of the expression levels of virulence factors in ST764-t002 and ST764-t1084 isolates. (A) The levels of mRNA expression for the α-toxin regulators. (B) The levels of mRNA expression for the Sae target genes. Transcript levels were normalized to gyrB transcript level.
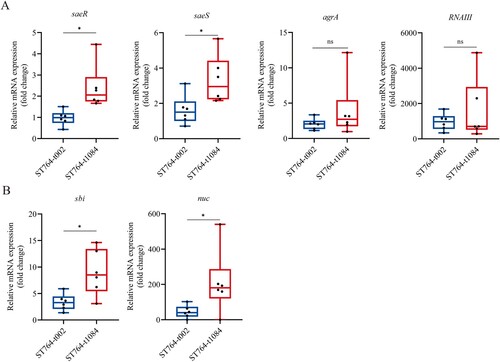
Figure 5. Comparison of the virulence of the ST764 S. aureus isolates in vivo. (A) Representative mouse back skin abscess after 48 h inoculation of isolates. Randomly selected three isolates in each spa type were used for infections in mouse back skin. N315 and USA300 were selected and compared with ST764. (B) Skin abscess areas of 40 mice (five mice for each group) using the formula π × (L × W) after 48 h infection. (C) Bacterial load in abscess homogenates was determined by serial dilution and culture on TSA plates. (D) The survival rates of Galleria mellonella larvae infected with ST764 S. aureus isolates.
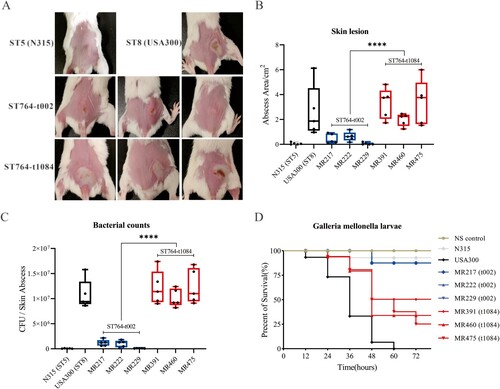
Figure 6. Phylogenetic analysis of ST764 S. aureus isolates. (A) ParSNP phylogenetic tree based on the 2301 core-SNPs of the 149 ST764 S. aureus isolates. Six groups of independent epidemics (paired SNPs of isolates ≤4 were defined as the same transmission) were identified. (B) Classification of Country, SCCmec type, spa type, and isolated year of the 149 isolates. The colours are the same as shown above. (C) Unrooted tree of ST764 S. aureus isolates. Branches in this tree could be classified into three clades, including Clade I, Clade II and Clade III. EICU: Emergency Intensive Care Unit; Burn Unit: The Department of burn unit; RICU: The Respiratory Intensive Care Unit; MICU: The Medical Intensive Care Unit; Cardiology: The Department of Cardiology; Pancreatic surgery: The Department of Pancreatic surgery.
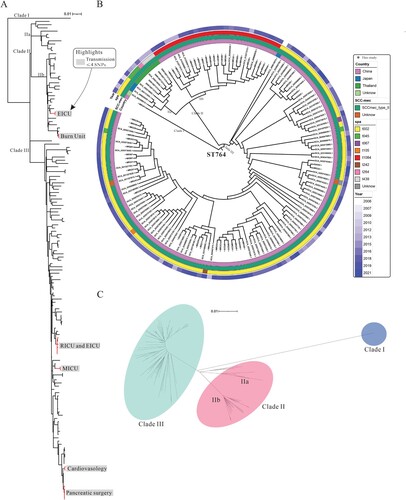
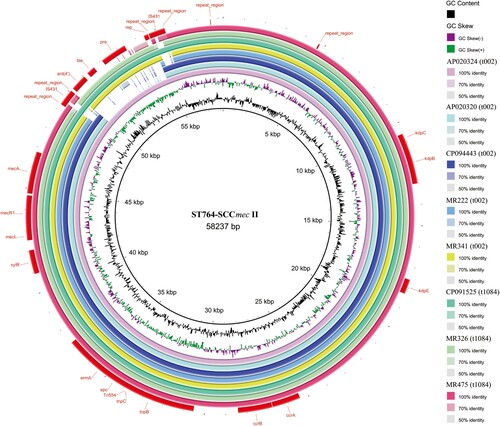
Figure 7. Structural comparison of SCCmec. Comparative structural analyses of SCCmec from eight isolates. The SCCmec in ST764 was compared with a reference SCCmec II sequence (S. aureus strain N315, GenBank accession number: D86934.2). Each circle represents an isolate. Isolates MR222, MR341, MR326 and MR475 were included in our data set, while genomic information for the remaining four isolates was retrieved from the NCBI database (GenBank accession number: AP020324, AP020320, CP094443 and CP091525). AP020320, CP094443 and CP091525 were used as reference strains. Isolates are grouped in different colours, and the blank places indicate differences.