Figures & data
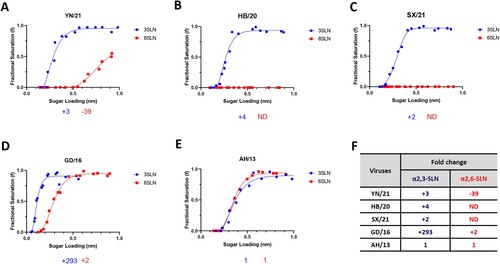
Figure 1. Receptor binding profiles of newly emerged H7N9 AIVs. The binding of purified reassortant H7N9 (A) YN/21, (B) HB/20, (C) SX/21, (D) GD/16 and (E) AH/13 to avian and human receptor analogues was measured by biolayer interferometry. (F) The fold-change of indicated reassortant viruses to avian (α2,3-SLN, shown in blue) and human (α2,6-SLN, shown in red) receptor analogues as compared to AH/13 was also shown below each figure. “-” indicates reduction, “+” indicates increase and “ND” = not detectable. The H7N9 AIVs was generated by reverse genetics with HA and NA from indicated H7N9 AIVs and the internal segments from PR8 H1N1 virus. Data is the combination of two repeats for each virus and receptor analogue combination.

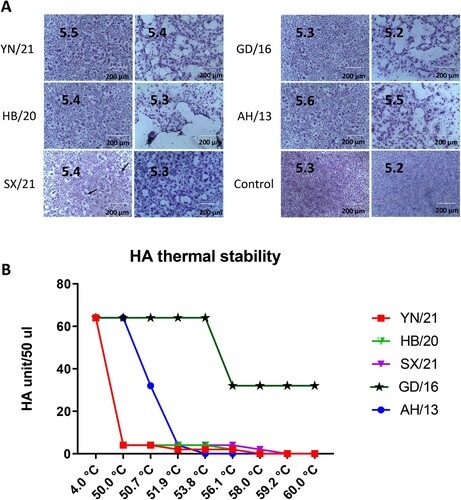
Figure 2. pH fusion and thermal stability of newly emerged H7N9 AIVs. (A) Syncytium formation in Vero cells infected with reassortant H7N9 AIVs (HB/20, SX/21 and YN/21), GD/16 and AH/13 with the HA and NA from H7N9 AIVs and the internal segments from PR8 H1N1 virus. The pH, at which 50% of maximum syncytium formation (indicated by black arrow) was observed, was taken as the predicted pH of fusion, shown on the left panel. The syncytium formation at 0.1 pH unit lower than the fusion threshold were shown on the right panel. The uninfected cells treated with pH 5.2 and 5.3 were served as control. Results shown are representative of three experimental repeats. (B) HA thermal stability of reassortant H7N9 AIVs. 64 HA units of reassortant virus were either left at 4.0°C as control or heated at 50°C, 50.7°C, 51.9°C, 53.8°C, 56.1°C, 58.0°C, 59.2°C and 60°C for 30 min before the HA assay. Results shown are representative of three experimental repeats.

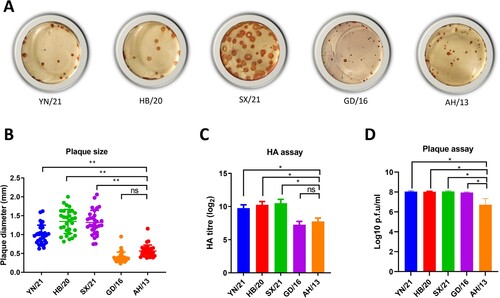
Figure 3. Plaque morphology and virus replication of the newly emerged H7N9 AIVs in MDCK cells and embryonated chicken eggs, respectively. (A) The plaque assay was performed in MDCK cells with reassortant newly emerged H7N9 AIVs (HB/20, SX/21 and YN/21), GD/16 and AH/13 with the HA and NA from H7N9 AIVs and the internal segments from PR8 H1N1 virus. (B) The plaque size for the reassortant newly emerged H7N9 AIVs (HB/20, SX/21 and YN/21), GD/16 and AH/13 in MDCK cells was measured by selecting 30 random plaques and plaque diameter was measured. The 10-day old embryonated eggs were inoculated with 100 plaque-forming units of the H7N9 AIVs for 48 h before allantoic fluid was harvested and the viral titres determined by (C) HA assay and (D) plaque assay Error bar = standard deviation. *p < 0.05; **p < 0.001; ‘ns’ = not significant. Results shown are representative of two experimental repeats.

Table 1. Cross-reactivity of mAbs with the newly emerged H7N9 AIVs.
Table 2. Amino acid residues of newly emerged H7N9 AIV HAs at position 125, 151, 217 and 385.
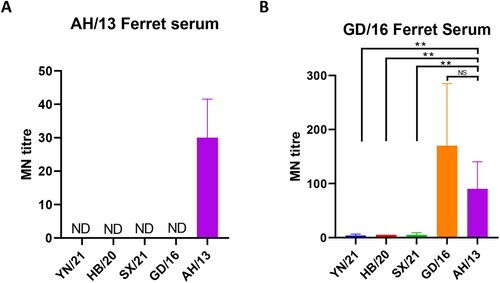
Figure 4. Neutralization of newly emerged H7N9 AIVs by (A) ferret antisera raised against AH/13 and (B) GD/16. The microneutralization assay was performed in MDCK cells with reassortant newly emerged H7N9 AIVs: HB/20, SX/21, YN/21, GD/16 and AH/13 with the HA and NA from H7N9 AIVs and the internal segments from PR8 H1N1 virus. The virus neutralization titre was expressed as the reciprocal of the highest serum dilution at which virus infection is blocked and the cells survive. Data are presented as mean ± SD and analysed by one-way ANOVA followed by Tukey’s multiple comparison test. Error bar = standard deviation. * p < 0.05; “NS” = not significant “ND” = no detection. “MN” = microneutralization.

Table 3. Cross-reactivity of newly emerged H7N9 AIVs with sera against WHO vaccine candidates.
