Figures & data
Figure 1. changes in the global gene expression of HBMECs infected by ZIKV. (a) Principal-component analysis (PCA) of mock- and ZIKV-infected samples in GSE98889. Expression values were log-transformed and scale-normalized. (b) Numbers of genes with significant differential expression (|log 2 (foldchange)| > 1 & P value < 0.05), orange and blue barplot indicate upregulated and downregulated genes, respectively. (c) Venn diagram depicting the overlap of significant DEGs between different time points. (d) Enriched gene ontology (GO) terms associated with “viral” and “virus” at each time point. (e) Time-course expression profiles of 941 differential expression genes across treatment. Columns indicate separate arrays and rows indicate genes grouped by Mfuzz clusters. Then the panel represents time-series differential expression (log 2 (foldchange)), the distribution of differential expression values across the time course (boxplot), the cumulative differential activity (barplot), and the direction of differential expression (heatmap, orange and blue indicate upregulation and downregulation).
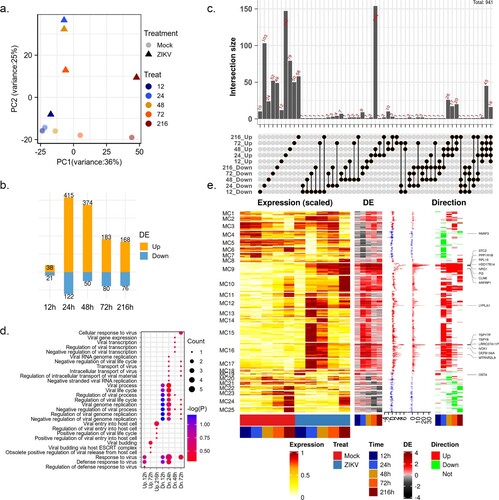
Figure 2. Expression of ZIKV-dependency genes and immune-related genes. Time-course expression profiles of ZIKV-dependency genes (a) and immune-related genes (d). (b) Representative GO terms for DEGs related to ZIKV-dependent genes. (c) The distribution of differential expression values of DEGs related to the immune system. (e) Representative GO terms for DEGs related to the immune system.
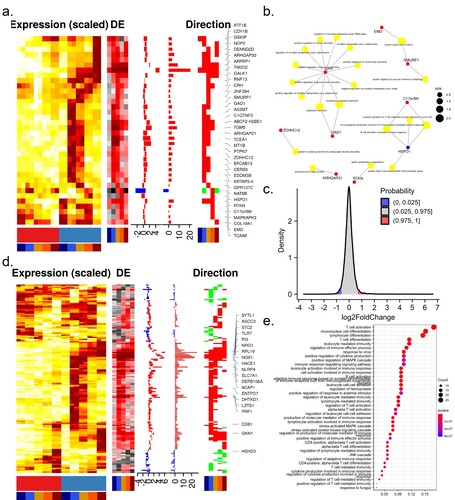
Figure 3. ZIKV infection reprogrammed host transcriptional structures. Representative gene clusters were identified by STEM clustering under mock- (a) and ZIKV (c) infection conditions, respectively. Red lines indicate the mean expression level of genes in each cluster. The number in the upper right corner of each panel represents the number of genes in each cluster. (b) Sankey diagram showing gene expression patterns of transition between mock (left side)- and ZIKV- infected (right side) conditions.
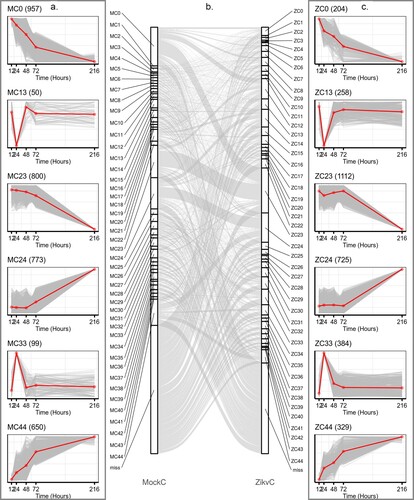
Figure 4. Prioritizing genes in module TVC7. (a) Venn diagram depicting the overlap between Mfuzz cluster MC9, and different co-expression modules TVC7 and TVC163. TVC7 and TVC163 are two clusters containing a set of genes, calculated by TimesVector v1.5. (a) vectorized clustering approach to the analysis of time series transcriptome data from two or more sample conditions, https://github.com/inukj/TimesVector). (b) TVC7 showed distinct co-expression patterns throughout the time course in response to mock and ZIKV infection. (c) The interactions of TVC7 proteins with viral proteins in HVIDB. (d) The regulatory network of TVC7. Each node indicated a protein, and each regulatory edge represented regulatory relationships predicted by NicheNet or host-virus protein-protein interactions in HVIDB. (e) Validation of the gene expression in TVC7 after ZIKV infection at 24 hpi using qPCR. (f) Validation of the gene expression in TVC7 in an external, clinical, and independent dataset from PRJNA578707. (g) Validation of genes in TVC7 via siRNA-mediated knockdown. ZIKV infection relative to NT siRNA control following siRNA-mediated knockdown of genes in TVC7 measured by the expression level of viral RNA, MV represents mock treatment before virus infection.
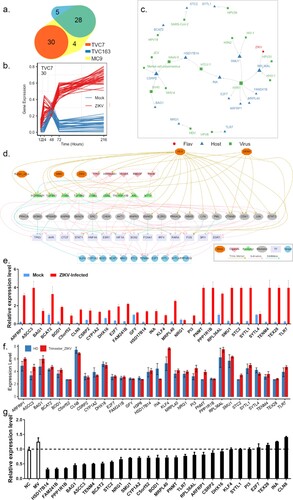
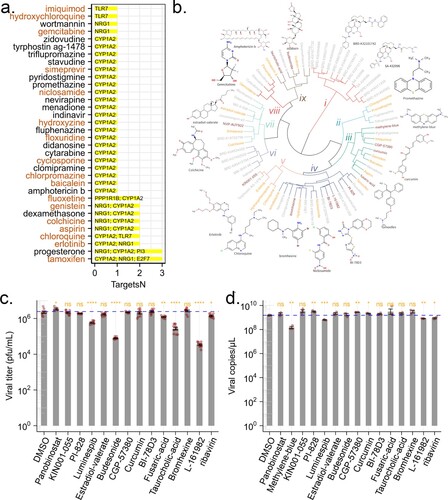
Figure 5. Predicted anti-ZIKV agents and their effect on viral infection. (a) Candidate drugs that target TVC7. Drug candidates against TVC7 were identified by cross-referencing with DGIdb. Drugs targeted more than two genes in TVC7 or retrieved from the PubChem database as potential antiviral agents were shown. Red fonts indicated known anti-ZIKV agents. (b) Chemical structure similarity clustering of drugs identified by signature-based drug repositioning (top 40) and cross-reference with DGIdb. Different coloured branches indicated compounds with distinct chemical structures. Genes with orange colours represent known anti-ZIKV agents, darkred represents compounds being tested in this work, and grey represents others identified here. (c) and (d), ZIKV infectious titres and RNA levels in the culture supernatant of HBMECs at 48 h post-infection with ZIKV at MOI 1 and treated with the indicated compounds, 20 μM Ribavirin, or equivalent volumes of the solvents DMSO. DMSO served as a negative control for all compounds. ZIKV RNA levels were measured by RT-qPCR. ZIKV titres were measured by plaque assay. Data were analysed with student’s t-test, (*p < 0.05; **p < 0.01, ***p < 0.001, ****p < 0.001). Bars represent the mean ± SD of three biological replicates.