
Figures & data
Figure 1. Temporal distribution of published [Citation6–14,Citation23] and/or notified PCR-confirmed sporadic BoDV-1 encephalitis cases in Germany (acutely or retrospectively diagnosed) and the cases of a solid organ transplant cluster (related to a single donor), 1992–2021. Interviewed cases are shown in dark red. Underreporting and missed diagnosis of this rare disease is assumed, especially before the zoonotic potential of BoDV-1 became evident in 2018. Source of notified cases: Robert Koch Institute, Berlin, data as of 04/2022.
![Figure 1. Temporal distribution of published [Citation6–14,Citation23] and/or notified PCR-confirmed sporadic BoDV-1 encephalitis cases in Germany (acutely or retrospectively diagnosed) and the cases of a solid organ transplant cluster (related to a single donor), 1992–2021. Interviewed cases are shown in dark red. Underreporting and missed diagnosis of this rare disease is assumed, especially before the zoonotic potential of BoDV-1 became evident in 2018. Source of notified cases: Robert Koch Institute, Berlin, data as of 04/2022.](/cms/asset/b1714a5a-9cce-491e-bbed-330f0597afbc/temi_a_2174778_f0001_oc.jpg)
Figure 2. Places of residence of all 20 interviewed cases in Germany deceased in 1996–2021. Each red square equals one case relative to the known endemic area of animal Borna disease (in two shades of blue) [Citation26].
![Figure 2. Places of residence of all 20 interviewed cases in Germany deceased in 1996–2021. Each red square equals one case relative to the known endemic area of animal Borna disease (in two shades of blue) [Citation26].](/cms/asset/2a774976-eeb1-4203-b4f5-649d74d00c3e/temi_a_2174778_f0002_oc.jpg)
Figure 3. Symptom onset as reported by family members of all 20 interviewed cases by calendar month. So far, a possible seasonality cannot be recognized.
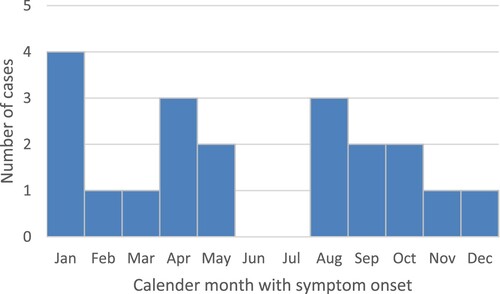
Figure 4. Relative age distribution of BoDV-1 cases (red) and general population (blue) in the counties with cases. Counties with two cases were counted twice. Population data from the Federal Statistical Office of Germany (DESTATIS), census data as of 31 December 2020.
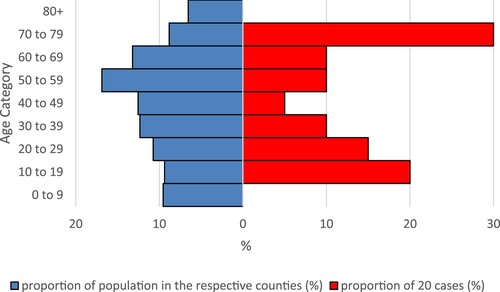
Figure 5. Distribution of the sizes of 18 cases’ cities/communities of residence in the federal state of Bavaria compared to the Bavarian cities/communities ranked by population size (in deciles). Most BoDV-1 encephalitis cases are found in small and very small cities/communities. Population data from the Bavarian Statistical Office, census data as of 31 December 2020.
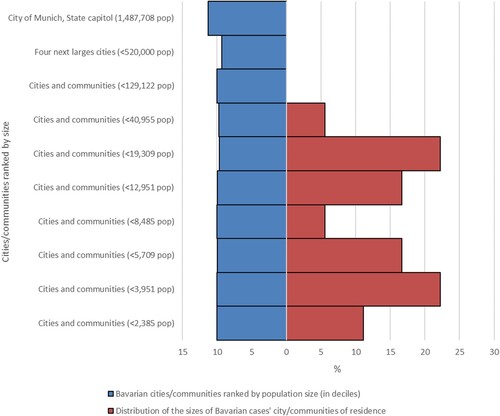
Figure 6. Locations of all 20 cases’ households relative to the centre and the margin of the (closest) built-up area. The red dot shows the respective location of the household, the star the centre of the settlement (defined by the location of the church, commercial clusters etc.), the grey area demarcates the built-up area. Green colour denotes open land. Distances are given in metre. Distances between households (within the built-up area) and the margin of the built-up area are zero metres if not indicated otherwise (panel 1, 4, 6, 7, 10, 12, 15, 16, 18, 20). Panels 2, 9, 11, 13, and 14 represent isolated locations outside of built-up areas whereas all others represent locations on the fringe of the settlement. For the sake of analyses, 19 was regarded as living centrally (neither on the fringe nor isolated).
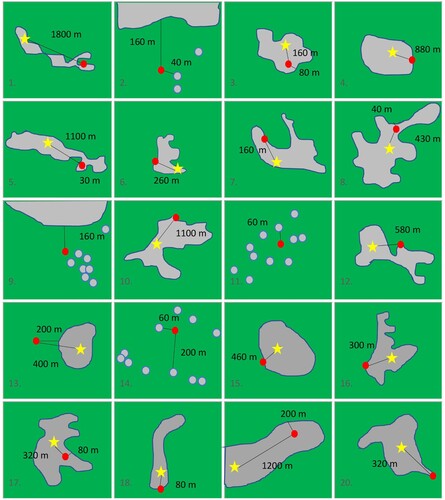
Table 1. Results of the case-control analysis with univariable and multivariable logistic regression and individual matching.