Figures & data
Figure 1. Interaction of IBV nsp12 with p50 in vitro and in cells overexpressing the two proteins. (a) Expression and purification of GST-p50C fusion protein. GST and GST-p50C fusion protein were expressed in E. coli and partially purified with glutathione-Sepharose 4B beads. The proteins were separated on an SDS-12% polyacrylamide gel and visualized by Coomassie brilliant blue staining. Numbers on the left indicate sizes in kilodalton. (b) Interaction of IBV nsp12 with p50C by GST pulldown assay. GST and GST-p50C were used to pull down the 35S-labeled in vitro translated nsp12. Precipitates and in vitro translated products were detected by autoradiography, and GST protein was used as a negative control. Numbers on the left indicate sizes in kilodalton. (c) Interaction of IBV nsp12 with p50 in cells overexpressing the two proteins. 293 T cells were transfected with Flag-tagged IBV nsp12 (F-IBV nsp12) and Myc-tagged p50 (M-p50) either alone or together. Cells were harvested at 24 h post-transfection, lysed with RIPA buffer, and subjected to immunoprecipitation with anti-Myc-coated beads. Total cell lysates (top two panels) and precipitates (bottom two panels) were immunoblotted using anti-Flag and anti-Myc antibodies, respectively. Numbers on the left indicate sizes in kilodalton.
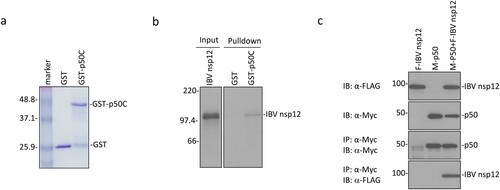
Figure 2. Induction of DNA damage response and cell cycle arrest in S phase in cells overexpressing IBV nsp12. (a) Induction of DNA damage response in cells overexpressing IBV nsp12. H1299 and DF-1 cells were transfected with Myc-tagged IBV nsp12, fixed at 48 h post-transfection, stained with DAPI and co-immunostained with mouse anti-Myc and rabbit anti-γH2AX antibodies, and examined by microscopy. (b) Induction of S-phase arrest in cells overexpressing IBV nsp12. Hl299 cells transfected with IBV nsp12 and nsp13 either alone or together were fixed at 24 h post-transfection and stained with PI. Cell cycle profiles were determined by flow cytometry. Data were analysed by using ModFit LT 5.0 software to determine the percentage of cells at each stage of the cell cycle in asynchronously growing cells. Results are presented as three replicate experiments. Significance levels were presented by the p-value (**, p < 0.01; ***, p < 0.001). (c) Induction of cell cycle arrest in DF-1 cells overexpressing IBV nsp12. DF-1 cells transfected with IBV nsp12 and nsp13 either alone or together were fixed at 24 h post-transfection and analysed as in (b). Results are presented as three replicate experiments. Significance levels were presented by the p-value (**, p < 0.01; ***, p < 0.001).
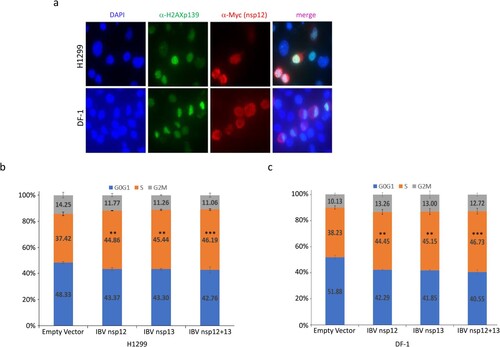
Figure 3. Subcellular localization of IBV nsp12. (a) Schematic diagram showing the genome structure of IBV and the position of the HA tag inserted in the recombinant IBV (rIBV-HA-RdRP) harbouring an HA-tagged RdRP. (b) Growth kinetics of rIBV-HA-RdRP. The growth kinetics of wild type (WT-rIBV) and rIBV-HA-RdRP were determined in cell lysates harvested at the indicated time points post-infection, using the TCID50 method. IBV titers are expressed in log TCID50 per millilitre. (c) Analysis of the HA-tagged RdRP (HA-nsp12) expression in H1299 cells infected with rIBV-HA-RdRP. Cells were infected with wild type IBV and rIBV-HA-RdRP at an MOI∼2, respectively, harvested at 20 h post-infection, and lysates prepared. Protein samples were separated by SDS-PAGE and analysed by Western blotted with anti-HA and anti-IBV N antibodies. β-Actin was used as a loading control. The sizes of the protein ladder in kDa are shown on the left. (d) Subcellular localization of the HA-tagged IBV nsp12 in infected cells. Vero cells were infected with rIBV-HA-RdRP at an MOI∼1, fixed at 0, 8 and 16 h post-infection, respectively, immunostained with mouse anti-HA antibody, and examined by confocal microscopy. Blue represents nuclei staining with DAPI and green represents HA-tagged nsp12.
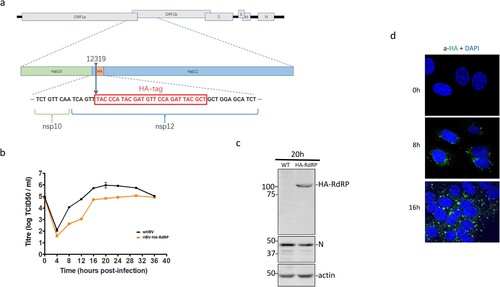
Figure 4. Interaction of IBV nsp12 with p50 in IBV-infected cells. (a) Co-precipitation of the endogenous p50 with HA-tagged nsp12 in cells infected with rIBV-HA-RdRP. H1299 cells were infected with wild type IBV (wtIBV) and rIBV-HA-RdRP at an MOI∼1, respectively, harvested at 10 h post-infection, and total cell lysates were prepared. Proteins in total cell lysates were either resolved directly on 8% SDS-PAGE or immunoprecipitated with anti-HA beads prior to loading on the gel. Immunoblotting was performed with anti-HA, anti-p50 and anti-IBV N antibodies, respectively. The sizes of the protein ladder in kDa are shown on the left. (b) Co-localization of p50 and HA-tagged nsp12 in the nuclei of IBV-infected cells. Vero cells were infected with rIBV-HA-RdRP, fixed at 10 h post-infection, and co-immunostained with mouse anti-p125 and rabbit anti-HA antibodies. (c) Induction of cell cycle arrest in IBV-infected DF-1, H1299 and HeLa cells. DF-1, H1299 and HeLa cells were infected with IBV at an MOI∼1, respectively, harvested at indicated times post-infection, and stained with PI for flow cytometry analysis. Data were analysed using ModFit LT 5.0 software to determine the percentage of cells at each stage of the cell cycle in asynchronously growing DF-1, H1299 and HeLa cells. Results are presented as three replicate experiments. Significance levels were presented by the p-value (ns, non-significance, *, p < 0.05; **, p < 0.01; ***, p < 0.001).
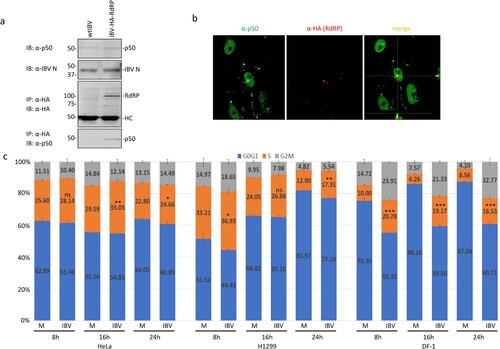
Figure 5. Interaction of SARS-CoV and SARS-CoV-2 nsp12 with p50 and induction of cell cycle arrest in S phase. (a) Interaction of SARS-CoV nsp12 with p50 in cells overexpressing the two proteins. 293 T cells were transfected with Flag-tagged SARS-CoV nsp12 (F-SARS nsp12) and Myc-tagged p50 (M-p50) either alone or together. Cells were harvested at 24 h post-transfection, lysed with RIPA buffer, and subjected to immunoprecipitation with anti-Myc-coated beads. Total cell lysates (top two panels) and precipitates (bottom two panels) were immunoblotted using anti-Flag and anti-Myc antibodies, respectively. Numbers on the left indicate sizes in kilodalton. (b) Interaction of SARS-CoV-2 nsp12 with p50 in cells overexpressing the two proteins. 293 T cells were transfected with Flag-tagged SARS-CoV-2 nsp12 (F-SARS2 nsp12) and Myc-tagged p50 (M-p50) either alone or together. Cells were harvested and analysed as in (a). (c) Induction of cell cycle arrest in cells overexpressing SARS-CoV nsp12. Hl299 cells transfected with SARS-CoV nsp12 and nsp13 either alone or together were fixed at 24 h post-transfection and stained with PI. Cell cycle profiles were determined by flow cytometry. Data were analysed using ModFit LT 5.0 software to determine the percentage of cells at each stage of the cell cycle in asynchronously growing cells. Results are presented as three replicate experiments. Significance levels were presented by the p-value (*, p < 0.05; **, p < 0.01; ***, p < 0.001) (d) Induction of cell cycle arrest in cells overexpressing SARS-CoV-2 nsp12. Hl299 cells transfected with SARS-CoV-2 nsp12 and nsp13 either alone or together were fixed at 24 h post-transfection and analysed as in (c). Results are presented as three replicate experiments. Significance levels were presented by the p-value (*, p < 0.05; **, p < 0.01; ***, p < 0.001).
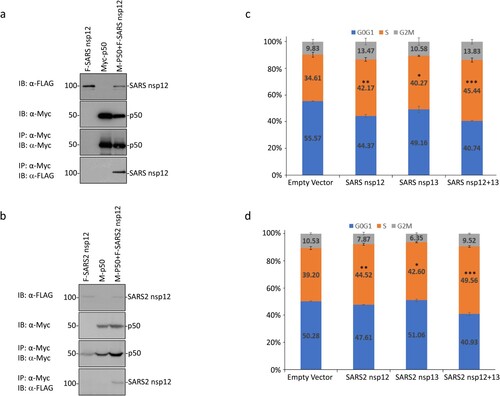
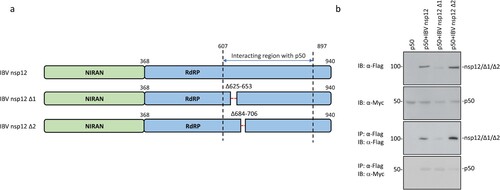
Figure 6. Identification of domain(s) in IBV nsp12 responsible for the interaction between nsp12 and p50. (a) Schematic diagram showing the construction of two deletion mutants of IBV nsp12, IBV nsp12 Δ1 and IBV nsp12 Δ2. The amino acid positions of two functional domains, RdRP and the Nidovirus RdRP-associated nucleotidyl transferase (NiRAN), and the deleted regions are indicated. (b) Co-immunoprecipitation of p50 with wild type and IBV nsp12 deletion mutants. HEK293T cells were transfected with wild type and the two deletion constructs, harvested at 24 h post-transfection, lysed with RIPA buffer and subjected to immunoprecipitation with anti-Flag beads. Total cell lysates and precipitates were analysed by Western blot with anti-Flag and anti-Myc antibodies, respectively. Numbers on the left indicate protein sizes in kilodalton.