Figures & data
Figure 1. Establishment of CVA19 mice model. The body weight (A-a and B-a), clinical scores (A-b and B-b), and survival rates (A-c and B-c) were monitored and recorded daily until 15 dpi, in the inoculation dosage-, and age-dependent experiments. (C) Five representative pictures of clinical signs. The black arrows indicated the paralysed limbs of infected mice. Data represent the mean ± SD. Different groups vs control, *P < 0.05, **P < 0.01, ***P < 0.001, ****P < 0.0001; ns, non-significant.
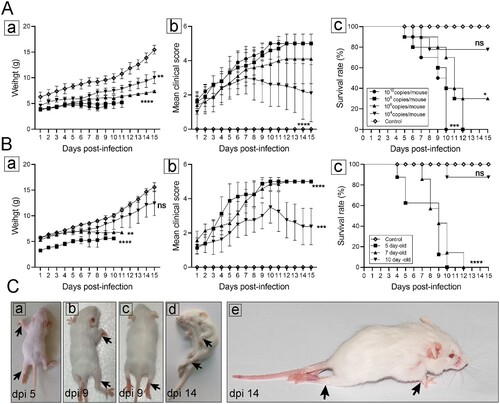
Figure 2. Viral loads in multiple organs. Seven-day-old ICR mice were i.g. inoculated with a lethal dose of CVA19. At 3, 5, and 8 dpi, infected mice (n = 4) were euthanized and viral loads were assessed by qRT-PCR in tissue samples. Results represent the mean viral load (Log10 (viral RNA copies/mg or mL) tissues or blood) ± SD.
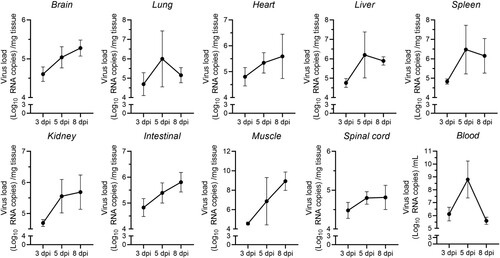
Figure 3. CVA19 directly infects brain neurons and induces neurological pathological damage. H&E staining and Nissl staining (A) were used to evaluate the pathological changes of brains in severe infected mice. The black arrows indicated typical pathological changes. (B) Fluorescence signals representing viral RNA in the neurons (cerebral cortex) were indicated by white arrows utilizing IF and FISH testing. WB analysis (C) was used to detect the expressions of cleaved-Caspase3 and GFAP in brains (n = 3 per group). The representing VP1 band was the agarose gel electrophoresis image (917 bp, primer sequence: Forward, GACACACAGTCTAGCGGACC; Reverse, TTGACGGCCTTCTCCATGTC). The protein expression level was expressed as mean ± SD. (D) Fluorescence signals representing viral RNA in the astrocytes (hippocampus) were indicated by white arrows utilizing IF and FISH testing. The variance analysis was conducted by two-tailed Student’s t-test on performing the comparison of two groups. Mild or severe group vs mock, * P < 0.05.
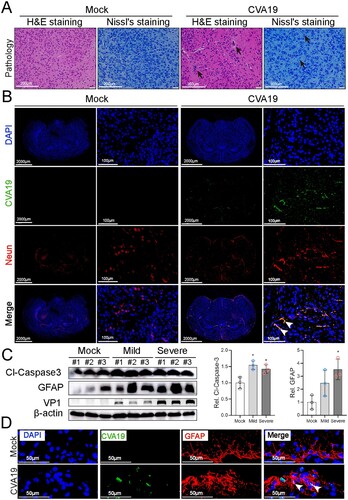
Figure 4. CVA19 infects motor neurons of spinal cord and further leads to acute flaccid paralysis. (A) Histopathological examination of spinal cords from infected severe mice by H&E staining and Nissl’s staining. The black arrows indicated karyopyknotic and hyperchromatic nuclear, reduced or disappeared Nissl bodies, as well as the vacuolization of nuclei. (B) Strong viral RNA signals and apparent loss were detected in spinal motor neurons of both the left and right horns (white arrows) in CVA19-infected mice. The white dashed boxes marked the sites where the images were taken from (anterior horn of the spinal cord). (C) WB analysis was applied to detect the expression of cleaved-Caspase3 and GFAP in the spinal cords (n = 3 per group). The representing VP1 band was the agarose gel electrophoresis image (917 bp). The protein expression level was expressed as mean ± SD. The variance analysis was conducted by two-tailed Student’s t-test on performing the comparison of two groups. Mild or severe group vs mock, * P < 0.05, **P < 0.01.
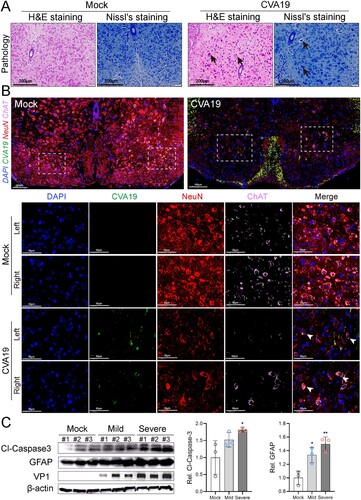
Figure 5. Ultrastructure of spinal cord neurons after CVA19 infection. Inoculation of lysis supernatants of spinal cords from infected mice leads to limb paralysis in 3-day-old mice. (A–C) Ultrastructure of uninfected spinal cord neurons. Intact nuclear (N); Endoplasmic reticulum (ER); Mitochondria (M); Axon (AX); Nissl’s bodies (NB). (D–I) Ultrastructure of infected spinal cord neurons. Pyknotic nucleus and indistinguishable indented nuclear membrane (D, yellow arrows); Disappearance or decrement of Nissl substance (E, green arrows). Relatively dense atrophic mitochondria (F, red arrow). ER with swollen cisternae, dilation and irregular arrangement of mitochondrial cristae (F and G). CVA19 particles in infected neurons (H and I, blue arrows). Vacuoles (V); Myelin sheath (MY). The scale bar has been indicated in the figures. (J) The procedure of the experiment and the production steps of the spinal cord lysate supernatant. The black arrow indicated typical paralysed limbs. The weight (K), clinical manifestation (L), and survival rates (M) were monitored and recorded daily until 7 dpi. The Mantel–Cox Log-rank test was used to compare the survival rates of mice in different groups. The variance analysis was conducted by a two-tailed Student’s t-test on performing the comparison of two groups. Data represent the mean ± SD. Different groups vs negative control, *P < 0.05, **P < 0.01, ****P < 0.0001; ns, non-significant.
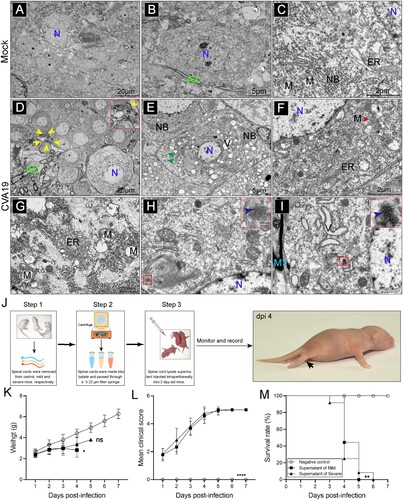
Figure 6. CVA19 leads to small bowel inflammatory injury and diarrhoea in mice. Diarrhoea symptoms in infected mice (A-a) and the black arrow indicate soft yellow faeces. (A-b) Perianal staining of the coat. Macroscopic observations of the intestine of representative mice from CVA19-infected mice (A-c) and mock mice (A-d) at 6 dpi. (B) The severity of diarrhoea (n = 7 per group) was scored at 6 dpi (0, normal stool or absent; 1, slightly wet and soft stool; 2, wet and unformed stool with moderate perianal staining; 3, watery stool with severe perianal staining). (C) The MPO activity of small intestine (n = 7 per group). (D) The pathology of small intestine was assayed at 10 dpi according to H&E, PAS, and AB staining. (E) The colocalization of CVA19 viral RNA and cleaved-caspase3 (white arrows). IF was performed to localize leukocytes (F), monocytes (G), and neutrophils (H). Data were expressed as mean ± SD and analysed by Student’s t test. CVA19 group vs mock groups, **P < 0.01, ****P < 0.0001.
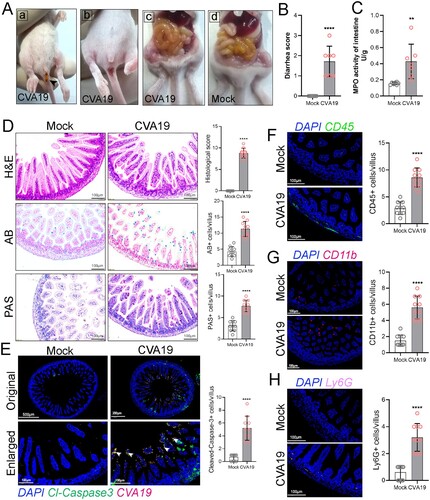
Figure 7. CVA19 infection induces a systemic inflammatory response. The numbers of white blood cell (WBC) (A-a), lymphocytes (A-b) as well as granulocyte (A-c) and monocyte (A-d) of CVA19 infection group were detected at 3, 5, and 8 dpi (n = 4–7 per group). The concentrations of IL-6 (B-a), TNF-α (B-b) CXCL-1 (B-c), and MCP-1 (B-d) in serum were measured by ELISA. The results were expressed as the mean ± SD or median with range. The difference analysis was conducted by two-tailed Student’s t-test or Mann-Whiteny test. Different groups vs mock group, *P < 0.05, **P < 0.01.
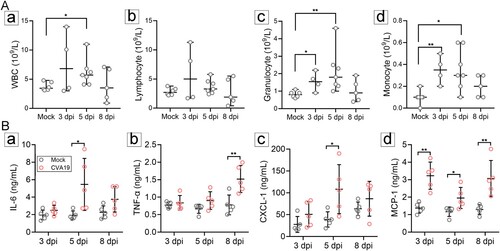
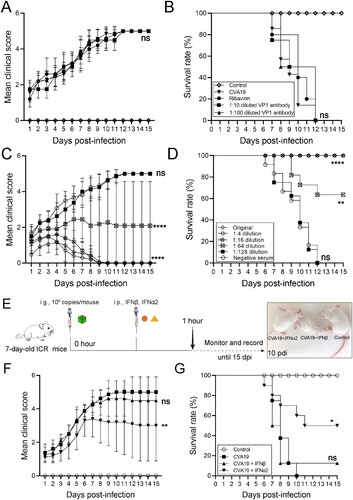
Figure 8. The protective efficacy of ribavirin, CVA19 VP1 mAb and CVA19 antisera, type I IFNs. Groups of 7-day-old neonatal ICR mice (n = 8–10 per group) were inoculated with CVA19 via the i.g. route. Within 1 h after infection, mice were given corresponding treatments as mentioned above. The clinical manifestations (A and C) and mortality (B and D) were monitored and recorded daily until 15 dpi. (E) The experimental procedure. The clinical symptoms (F) and mortality rate (G) were monitored and recorded daily until 15 dpi. The Mantel-Cox Log-rank test was used to compare the survival rates of mice in different groups. The difference analysis was conducted by two-tailed Student’s t-test. Data represent the mean results ± SD. Different groups vs CVA19 group, *P < 0.05, **P < 0.01, ****P < 0.0001; ns, non-significant.