Figures & data
Figure 1. Construction of a Cas13a-crRNA Detection System for HBV DNA. Data are representative of at least three independent experiments. (****<0.0001, ***<0.001, **<0.01) (A) Process of the Cas13a-crRNA detection system for HBV DNA detection. (B) The schematic diagram of the design includes five crRNAs and four pairs of RAA primers, and the band (5' to 3') indicates the conserved region of the HBV sequence that was screened. (C) Screening of RAA primers. HBV-positive plasmids (103 copies/μL) were amplified by RAA, and the amplified products were subjected to DNA agarose gel electrophoresis. Then, the F2R4 primers screened out were further verified by using an HBV-positive plasmid (105 copies/μL). (D) Screening of crRNA. The two figures are the comparison of the dynamic fluorescence curve and end-point fluorescence value of different crRNAs. The chosen RAA primers amplified the HBV-positive plasmid (103 copies/μL) and served as a template for Cas13a-crRNA fluorescence detection to verify five crRNAs. (E) Conservation analysis of selected crRNA and RAA primers by WebLogo.
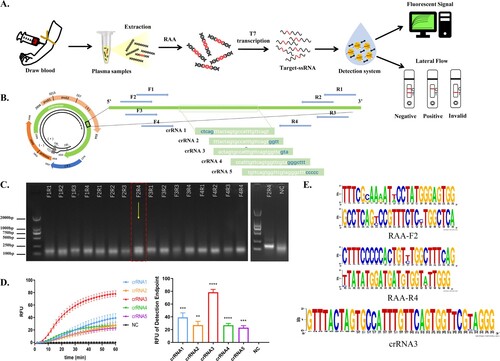
Figure 2. Capability of the Cas13a-crRNA Detection System for HBV DNA. Data are representative of at least three independent experiments. (NC: negative control, ND: no detection for HBV DNA in HBV-infected patients, ****<0.0001, ***<0.001, **<0.01, *<0.05). (A) The specificity assessment of the Cas13a-crRNA detection system using HBV, HCV, HDV, HEV, and HIV plasmid (103 copies/μL). (B) The alignment of conserved regions of HBV with other common clinical viruses (HIV, HCV, HDV, and HEV). RAA primer and crRNA-binding regions are highlighted in yellow and red, respectively. (C) The sensitivity assessment of the Cas13a-crRNA detection system by HBV plasmids diluted in gradient concentrations (100∼104 copies/μL). (D) qPCR amplification curves of HBV plasmids at different concentrations (100∼106 copies/μL). (E) The repeatability assessment of the Cas13a-crRNA detection system by HBV plasmid (103 copies/μL) (Standard Deviation, Std. dev.). (F) The specificity assessment of the Cas13a-crRNA detection system by clinical samples (103 IU/mL) and the sensitivity assessment of the Cas13a-crRNA detection system by clinical samples with different concentrations (104, 103, 102, 101, <10 IU/mL).
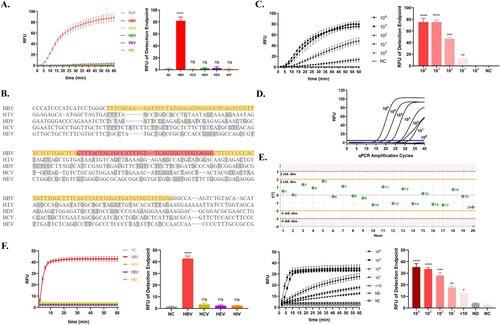
Figure 3. Optimization of the Cas13a-crRNA Detection System for HBV DNA. Data are representative of at least three independent experiments. (NC: negative control, *<0.05). (A) Optimization of sample lysis time (5, 15, 30, and 60 min) and sample lysis temperature (25, 37, 56, and 95°C). (B) Comparison of sample storage days (0, 1, 3, 5, and 7 days). (C) Optimization of RAA reaction time (5, 15, 30, 45, 60 min), temperature (25, 33, 36, 39, 42, 45°C) and template volume (2, 4, 6, 10 μL). (D) Optimization of CRISPR reaction time (10, 20, and 30 min) and temperature (25, 28, 31, 34, 37, 40, and 43°C). K1, K2 and K3 represent the slope of fluorescence curve at the time points of 10, 20 and 30 minutes of CRISPR reaction, reflecting the amplification efficiency. (E) Comparison of plasma and serum.
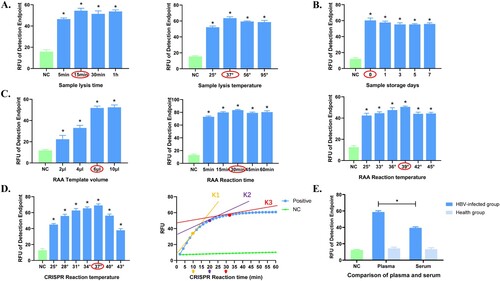
Figure 4. Cas13a-crRNA-Based Strip Assay for HBV DNA. Data are representative of at least three independent experiments. (NC: negative control, PC: positive control). (A) Schematic diagram of the Cas13a-crRNA nucleic acid detection strip. (B) The gradient concentration of HBV plasmids (10-1∼106 copies/μL) was assayed with a Cas13a-crRNA nucleic acid detection strip. The signal intensities of the T and C bands were generated using ImageJ software. (C) Clinical samples of HBV infection with different viral loads (<10∼106 IU/mL, n=42) were assayed with a Cas13a-crRNA nucleic acid detection strip. The signal intensities of the T and C bands were generated using ImageJ software.
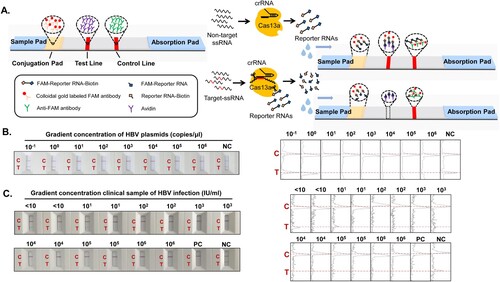
Figure 5. Figure 5. Cas13a-crRNA-Assisted HBV DNA Strip Assay in LLV Patients. Data are representative of at least three independent experiments. (NC: Negative Control, PC: Positive Control, HP: Healthy People, ND: No detection for HBV DNA in HBV-infected patients, <10: The content of HBV DNA in the sample was 10 IU/mL, 101: The content of HBV DNA in the sample was 101 IU/mL, 102: The content of HBV DNA in the sample was 102 IU/mL, 103: The content of HBV DNA in the sample was 103 IU/mL.). (A) LLV clinical samples (<10∼103 IU/mL) of HBV infection were assayed with a Cas13a-crRNA nucleic acid detection strip. The signal intensities of the T- and C-bands were generated using ImageJ software. (B) Analysis of positive/negative coincidence rate about Cas13a-crRNA assay for detection of HBV DNA in HBV-infected patients.
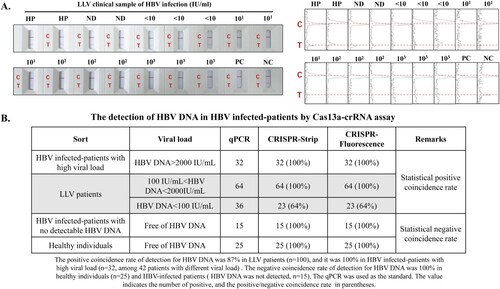
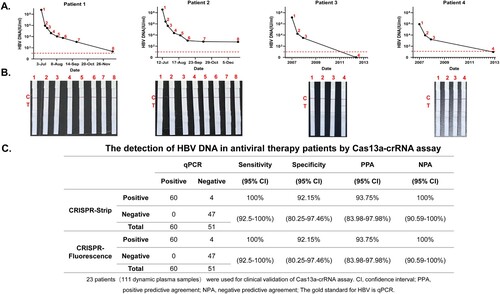
Figure 6. Cas13a-crRNA-Assisted HBV DNA Strip Assay in Antiviral Therapy Patients. Data are representative of at least three independent experiments. (A) The dynamic line chart by GraphPad Prism shows the changes in HBV DNA levels (IU/mL) in patients treated with antiviral therapy. (B) Antiviral therapy dynamic plasma samples (IU/mL) were assayed with a Cas13a-crRNA nucleic acid detection strip. (C) Analysis of sensitivity, specificity, PPA, and NPA about Cas13a-crRNA assay for detection of HBV DNA in antiviral therapy patients.