Figures & data
Figure 1. NSUN2 negatively regulates antiviral innate type I interferon responses. (a) qPCR analysis of IFNB1 mRNA in HEK293T cells transfected with siControl or siRNAs targeting different RNA methyltransferases or demethylases for 36 h, with or without infection by SeV for another 8 h. (b) Dual-luciferase assay analysing IFN-β promoter activity (IFN-β-Luc) in HEK293T cells in 24-well plates transfected for 24 h with 100 ng IFN-β-Luc plasmid and 20 ng Renilla luciferase plasmid (RL-TK) along with vector or increasing amounts (0, 0.1, 0.2, and 0.5 μg) of plasmid encoding NSUN2, with or without infection by SeV, for another 10 h. (c) Dual-luciferase analysis of IFN-β-Luc in HEK293T cells in 24-well plates transfected for 24 h with vector (Vec) or NSUN2, with or without infection by SeV or VSV for another 10 h, or transfected with poly (I:C) (1 µg/mL) for another 10 h. (d) qPCR analysis of IFNB1, ISG15, CXCL10 and NSUN2 mRNA in HEK293T cells transfected with siControl or siRNAs targeting NSUN2, with or without infection by SeV for 8 h. Immunoblot analysis shows knockdown efficiency of siRNAs targeting NSUN2. (e) qPCR analysis of IFNB1, ISG15 and CXCL10 mRNA in wild-type HEK293T cells or NSUN2−/− HEK293T cells, with or without infection by SeV for 8 h.
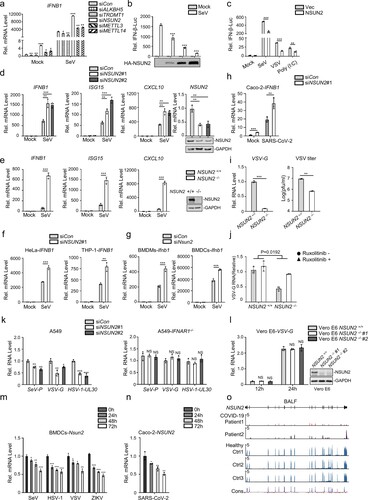
Figure 2. NSUN2 inhibits the expression level of IRF3. (a) Dual-luciferase assay analysing a luciferase reporter plasmid for the IRF3-responsive promoter containing positive regulatory domains III and I of the IFN-β promoter (PRDIII-I-Luc) in HEK293T cells in 24-well plates transfected for 36 h with the RIG-N, MDA5-N, MAVS, TBK1, and IRF3-5D expression plasmids, as indicated, with co-transfection with empty vector or NSUN2. (b) Dual-luciferase analysis of PRDIII-I-Luc in HEK293T cells in 24-well plates transfected for 36 h with the indicated RIG-N, MDA5-N, MAVS, TBK1, and IRF3-5D expression plasmids with co-transfection with siControl or siNSUN2-1. (c) Immunoblot analysis in HEK293T cells transfected with vector or NSUN2 for 36 h, with or without infection by SeV for another 12 h. (d) Immunoblot analysis in wild-type HEK293T cells or NSUN2−/− HEK293T cells with or without infection by SeV for 12 h. (e) Immunoblot analysis in wild-type A549 cells or NSUN2−/− A549 cells with infection by SeV for 0, 4, 8, and 12 h. (f) Immunoblot analysis in wild-type HEK293T cells or NSUN2−/− HEK293T cells, with infection by SeV for 0, 4, 8, and 12 h. (g) qPCR analysis of IFNB1 mRNA in wild-type HEK293T cells or NSUN2−/− HEK293T cells transfected with vector or NSUN2, with co-transfection with vector or IRF3-FL, as indicated, with infection by SeV for 12 h. (h) qPCR analysis of VSV-G or HSV-1-UL-30 RNA in Irf3−/−Irf7−/− MEFs transfected with vector or NSUN2, with co-transfection with vector or IRF3-FL, as indicated, with infection by VSV or HSV-1 for 12 h. Data are representative of three independent experiments and were analysed by two-tailed unpaired t test (or by two-factor ANOVA test for 2 h and 2i). Graphs show the mean ± SD (n = 3) derived from three independent experiments. NS, not significant for P > 0.05, *P < 0.05, **P < 0.01, ***P-< 0.001.
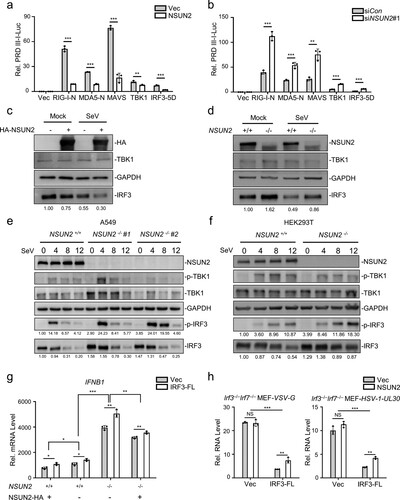
Figure 3. NSUN2 interacts with IRF3 mRNA and induces its degradation. (a) Coimmunoprecipitation (IP) and immunoblot (IB) analysis of HEK293T cells transfected with plasmids encoding HA-NSUN2 and Flag-IRF3. (b) Immunoprecipitation by HA-Tag-conjugated beads and immunoblot analysis of HEK293T cells transfected with plasmids encoding HA-NSUN2, with SeV infection for 8 h, followed by RNA extraction and qPCR analysis of combined IRF3 mRNA. (c) qPCR analysis of IRF3 mRNA and TBK1 mRNA in HEK293T cells transfected with siControl or siRNAs targeting NSUN2, with or without infection by SeV for 8 h. (d) qPCR analysis of IRF3 mRNA and TBK1 mRNA in wild-type HEK293T cells or NSUN2−/− HEK293T cells, with or without infection by SeV for 8 h. (e) Stability analysis of IRF3 mRNA and TBK1 mRNA in wild-type HEK293T cells or NSUN2−/− HEK293T cells with treatment of actinomycin D (ActD) for 0, 6, 12, and 18 h. (f) The piled reads of IRF3 mRNA from NSUN2-LACE-seq from SeV-infected cells: NSUN2−/− HEK293T (lower) and NSUN2−/− HEK293T with reconstitution of exogenous HA-NSUN2 (upper). Y-axis represents the normalized signals along the gene. Data are representative of three independent experiments and were analysed by two-tailed unpaired t test. Graphs show the mean ± SD (n = 3) derived from three independent experiments (or two independent experiments for 3f). NS, not significant for P > 0.05, *P < 0.05, **P < 0.01, ***P < 0.001.
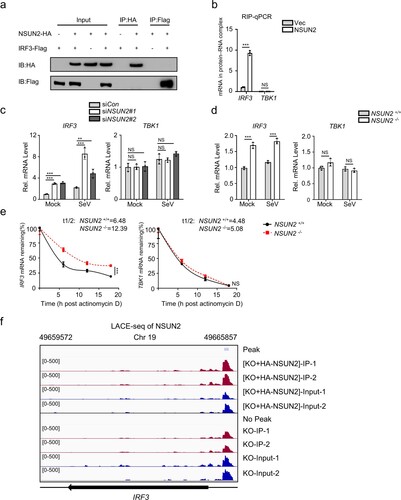
Figure 4. NSUN2 catalyzes the formation of m5C methylation of IRF3 mRNA both exogenously and endogenously. (a) Schematic diagram of the IRF3 mRNA segments used for in vitro methylation assays and bisulfite RNA sequencing. (b) In vitro m5C methylation assays using recombinant GST-NSUN2 and the in vitro transcripts. (c) In vitro m5C methylation assays using recombinant GST-NSUN2 and the in vitro transcribed segments of IRF3 mRNA depicted in (a). (d) m5C dot blot analysis of endogenous IRF3 mRNA (200 ng) pulled down by IRF3 CHIRP probes in wild-type HEK293T cells or NSUN2−/− HEK293T cells with or without exogenous NSUN2 overexpression. Equal IRF3 mRNAs were also loaded and verified by methylene blue (MB) staining. (e) The m5C-RIP-qPCR analysis of the m5C methylated IRF3 mRNA immunoprecipitated by m5C antibody from wild-type HEK293T cells or NSUN2−/− HEK293T cells, with or without exogenous NSUN2 expression. TBK1 was used as a negative control. (f-g) RNA-seq of HEK293T cells or HEK293T cells with NSUN2 overexpression, with infection by SeV. The heatmap (f) shows the expression levels of ISGs and several signalling molecules. The genes that we focus on are labelled with asterisks. The column diagram (g) shows the SeV replication levels. (h) In vitro m5C methylation assays using recombinant GST-NSUN2 and different mutant proteins.
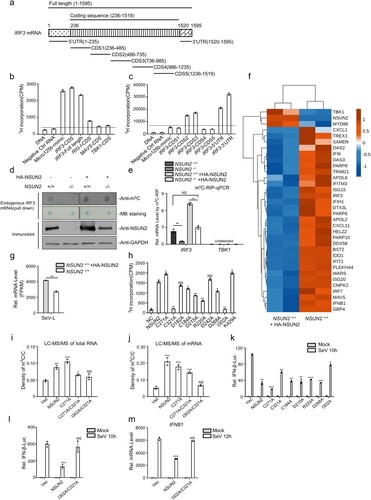
Figure 5. Knockout of NSUN2 decreased m5C methylation on IRF3 mRNA but increased IRF3 and IFNB1 and downstream ISGs mRNA levels. (a) RNA-seq analysis from SeV-infected A549 wild-type cells or A549 NSUN2 knockout cells. GO-term functional enrichment by biological process of up-regulated genes. Data show the top 10 biological processes. (b) The heatmap shows the expression levels of ISGs and several signalling molecules. The genes that we focus on are labelled with asterisks. (c) The column diagram shows the SeV replication levels. (d) The m5C-RIP-qPCR analysis of the m5C methylated mRNA levels immunoprecipitated by m5C antibody from A549 wild-type cells or A549 NSUN2 knockout cells. Data are representative of three independent experiments and were analysed by two-tailed unpaired t test. Graphs show the mean ± SD (n = 3) derived from three independent experiments. NS, not significant for P > 0.05, *P < 0.05, **P < 0.01, ***P < 0.001.
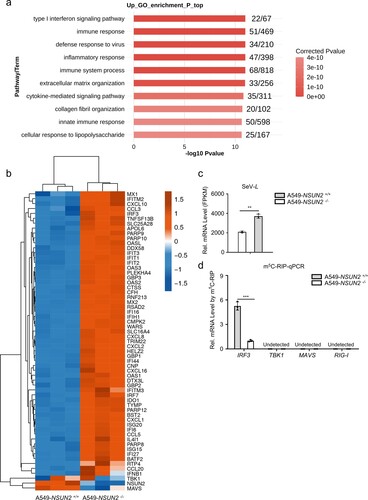
Figure 6. IRF3 m5C methylation site mutation results in enhanced IRF3 expression and antiviral response. (a) Visualization of m5C-MeRIP-seq results shows regions of enrichment for m5C immunoprecipitation (upper) over input (lower) from uninfected or SARS-CoV-2-infected Caco-2 cells. The positive m5C site identified by in vitro bisulfite RNA sequencing (c) are marked in red solid triangle and the control sites are marked in black hollow triangle which are not identified by in vitro bisulfite RNA sequencing and identified as no biological function (e–g). (b) Schematic depiction of in vitro bisulfite RNA sequencing to distinguish m5C (cytosine methylated by NSUN2) from C (cytosine not methylated). (c) Identification of m5C modification on cytosines of 5’UTR of IRF3 mRNA by bisulfite RNA sequencing. Data are expressed as the ratio of m5C to (C + m5C) from three independent replicates. (d) Wild-type HEK293T cells or NSUN2−/− HEK293T cells were transfected with pGL.3.0-CMV-Luc or pGL3.0-CMV-IRF3-CDS-Luc or pGL3.0-CMV-IRF3-5’UTR-Luc or pGL3.0-CMV-IRF3-3’UTR-Luc, together with Renilla luciferase (RL-TK). Forty-eight hours later, firefly luciferase activity against Renilla luciferase activity was analysed. (e) In vitro m5C methylation assays of the IRF3 segments or the cytosines mutated segments using recombinant GST-NSUN2. (f-g) qPCR analysis of IRF3 mRNA or Ifnb1 mRNA in Irf3−/−Irf7−/− MEFs transfected with plasmid encoding NSUN2 along with wild-type IRF3 full length (IRF3-FL-WT) or various cytosine-mutated IRF3-FLs for 48 h, as indicated, with stimulation by SeV for 8 h. Data are representative of three independent experiments and were analysed by two-tailed unpaired t test. Graphs show the mean ± SD (n = 3) derived from three independent experiments (or two independent experiments for 6e). NS, not significant for P > 0.05, *P < 0.05, **P < 0.01, ***P < 0.001.
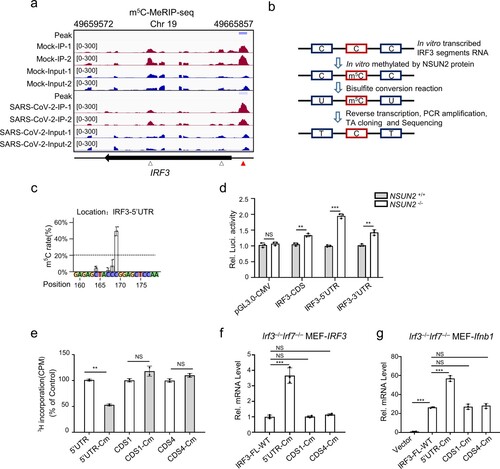
Figure 7. Pivotal role for NSUN2 in the induction of type I interferon and antiviral response in vivo. (a) Immunoblot analysis in BMDCs from Nsun2+/+ mice or Nsun2+/− mice with infection by SeV for 0, 4, and 8 h. (b) qPCR analysis of Nsun2 or Irf3 mRNA in BMDCs from Nsun2+/+ mice or Nsun2+/− mice. (c) qPCR analysis of Ifnb1 mRNA in BMDCs from Nsun2+/+ mice or Nsun2+/− mice, with or without infection by SeV for 8 and 12 h, HSV-1 for 3 and 6 h, or VSV for 6 and 12 h. (d) qPCR analysis of Isg15 and Cxcl10 in BMDCs from Nsun2+/+ mice or Nsun2+/− mice, with or without infection by SeV, HSV-1, or VSV. (e) qPCR analysis of SeV-P, VSV-G or HSV-1-UL-30 RNA in BMDCs from Nsun2+/+ mice or Nsun2+/− mice, with infection by SeV, VSV or HSV-1 for 12 h. (f) RNA-seq analysis from SeV-infected BMDCs from Nsun2+/+ mice or Nsun2+/− mice. The heatmap shows the expression levels of ISGs and several signalling molecules. The genes that we focus on are labelled with asterisks. (g) The m5C-RIP-qPCR analysis of the m5C methylated mRNA levels immunoprecipitated by m5C antibody from BMDCs from Nsun2+/+ mice or Nsun2+/− mice. (h) Stability analysis of Irf3 mRNA in BMDCs from Nsun2+/+ mice or Nsun2+/− mice, with treatment of actinomycin D (ActD) for 0, 4, and 8 h. (i) qPCR analysis of Ifnb1 mRNA and the corresponding VSV-G RNA in different organs from Nsun2+/+ mice (n = 5) or Nsun2+/− mice (n = 5), injected intraperitoneally for 16 h with VSV (4 × 10⁷ PFU per mouse).
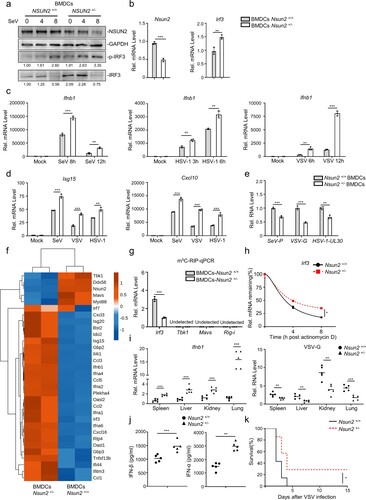
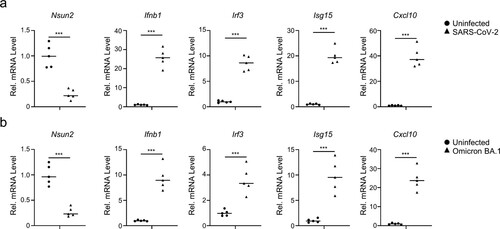
Figure 8. SARS-CoV-2 infection decreases Nsun2 expression levels and activates innate immunity responses in K18-hACE2 KI mice. (a) qPCR analysis of Nsun2, Irf3, Ifnb1, Isg15 and Cxcl10 mRNA in lungs from SARS-CoV-2 WT strain infected K18-hACE2 KI mice (n = 5) or uninfected K18-hACE2 KI mice (n = 5), injected intranasally for 48 h with SARS-CoV-2 WT strain (250 PFU per mouse). (b) qPCR analysis of Nsun2, Irf3, Ifnb1, Isg15 and Cxcl10 mRNA in lungs from SARS-CoV-2 BA.1 omicron variant infected K18-hACE2 KI mice (n = 5) or uninfected K18-hACE2 KI mice (n = 5), injected intranasally for 48 h with SARS-CoV-2 WT strain (8000 PFU per mouse). NS, not significant for P > 0.05, *P < 0.05, **P < 0.01, ***P < 0.001.