Figures & data
Table 1. Clinical characteristics of seven patients with fatal VSBV-1 encephalitis included in the study.
Table 2. Pathological changes in at least one brain MR examination in seven VSBV-1 encephalitis patients.
Figure 1. Number of affected brain regions on MR examination per patient and day after symptom onset. The number of affected regions increases markedly over time, well visible on the logarithmic scale. Patient G had a normal MR scan on day 2. Patient D1 had multiple follow-up MR examinations without further change in the number of affected brain regions (not shown). Patient F had one MR scan only. See also .
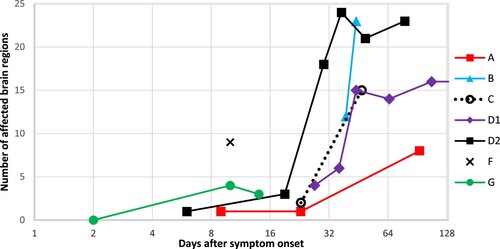
Table 3. Simplified summary of positive magnetic resonance T2 signal changes in anatomical brain regions per patient over time.
Figure 2. Transformation of the basal ganglia and respective changes on MR imaging over time. High signal of basal ganglia on T1 weighted imaging on day 49 after symptom onset (left; white arrowheads) and structural damage to the basal ganglia 72 days after symptom onset (right; black arrowheads).
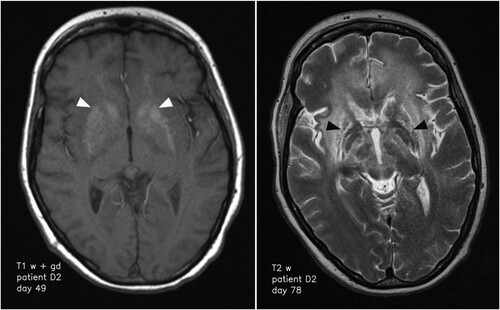
Figure 3. Axial T2 weighted images of patient D2 on days 30 and 78. Typical signal increase of the basal ganglia (white arrowheads) and the amygdala/hippocampus (white arrows) as well as hyperintensity in the mesencephalon (black arrow) and white matter (black arrowhead) is visible.
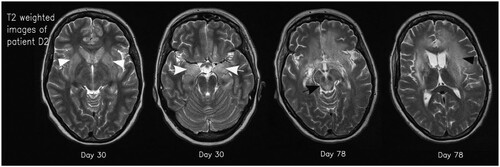
Figure 4. Representative asymmetric lesions. Axial T2 weighted image with left hemispheric changes of the globus pallidus (arrow) in patient B on day 39 (A). Axial FLAIR image with unilateral signal increase of cerebellar white matter (arrow) in patient D1 on day 107 (B). Axial T2 weighted image showing left hemispheric signal increase of the temporal lobe (arrow) in patient D2 on day 78 (C). Axial FLAIR image demonstrating unilateral signal increase of the left amygdala (arrow) in patient F on day 10 (D).
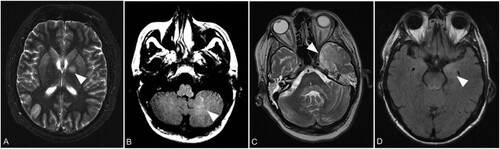
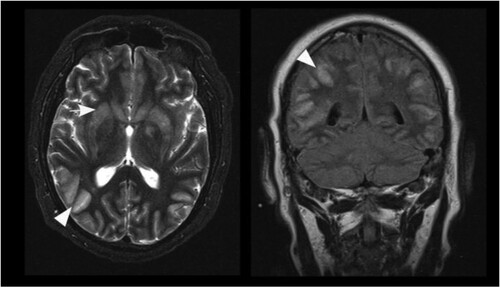
Figure 5. Axial T2 weighted image (left) and coronal FLAIR image (right) of patient B on day 44. Prominent cortical hyperintensities and swelling of cortical grey matter (arrowheads) dominate over signal increase of the basal ganglia (arrow) in this patient.