
Figures & data
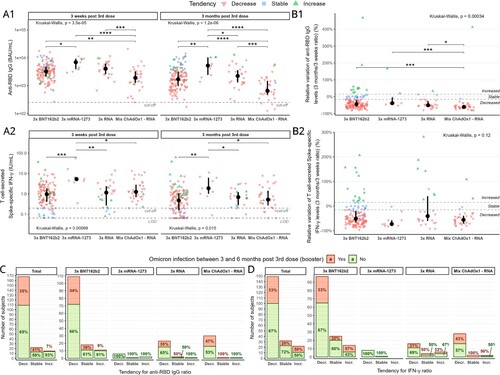
Figure 1. Humoral and cellular immune responses. Levels of A1 anti-RBD IgG (positivity cut-off = 250 BAU/mL) and A2 T cell-secreted Spike-specific IFN-γ (positivity cut-off = 0.2 IU/mL, LOD = 0.065 IU/mL) at 3 weeks and 3 months post booster dose. Values found under LOD have been substituted by LOD. Relative variation of levels (3 months/3 weeks ratio) for B1 anti-RBD IgG and B2 T cell-secreted Spike-specific IFN-γ. Stability range was determined as ±15% variance (within-laboratory precision) between timepoints (plus delta < 0.1 UI/mL for cellular response). Data were analysed with Kruskal-Wallis test followed by Dunn’s pairwise comparison without correction, if significant. The incidence of infection with Omicron according to tendency group for C anti-RBD IgG and D T cell-secreted Spike-specific IFN-γ. Difference in group composition was evaluated by odds-ratio test, followed by Fisher’s exact test. *p < 0.05; **p < 0.01; ***p < 0.001; ****p < 0.0001; BAU – binding antibody unit; IU – international unit; LOD – limit of detection.
Supplemental Material
Download MS Word (426.2 KB)Data availability statement
The datasets generated during and/or analysed during the current study are available from the corresponding author on reasonable request.