Figures & data
Figure 1. Temporally structured maximum-clade-credibility phylogenetic tree (years on the horizontal axis) of the HA gene of H13 AIVs. All H13 subtype strains were obtained from a public database. Both isolates (DZ137 and ZH385) used in this study, other isolates collected in China (A/black-tailed_gull/Weihai/115/2016 [H13N2], and A/black-tailed_gull/Weihai/17/2016 [H13N8]) are coloured green. The Bayesian posterior probabilities by which the associated taxa clustered together are shown next to the branches.
![Figure 1. Temporally structured maximum-clade-credibility phylogenetic tree (years on the horizontal axis) of the HA gene of H13 AIVs. All H13 subtype strains were obtained from a public database. Both isolates (DZ137 and ZH385) used in this study, other isolates collected in China (A/black-tailed_gull/Weihai/115/2016 [H13N2], and A/black-tailed_gull/Weihai/17/2016 [H13N8]) are coloured green. The Bayesian posterior probabilities by which the associated taxa clustered together are shown next to the branches.](/cms/asset/18dcc079-b9b7-4367-9529-795d8db55dc3/temi_a_2184177_f0001_oc.jpg)
Table 1. Chicken and wild bird serum survey for two AIV H13 subtypes from different locations in China, 2015–2016.
Figure 2. Viral growth kinetics of ZH385 and DZ137 strains in CEF, MDCK, 293 T, HBECs, and HAECs cell cultures. CEF, MDCK, 293 T, HBECs, and HAECs were infected at an MOI of 0.01. Cells were inoculated at an MOI of 0.01 TCID50/cell with DZ137 or ZH385. The supernatant of the plates was collected at 12, 24, 36, 48, 60, and 72 h post-inoculation. We determined the virus titres in MDCK cells using the TCID50 values. (a) CEF cells, (b) MDCK cells, (c) 293 T cells, (d) HBECs, and (e) HAECs. The virus titres are shown as the means log10TCID50/mL ± SDs. * indicates p < 0.05, ** indicates p < 0.01, and *** indicates p < 0.001 in comparison with the values for the DZ137 virus.
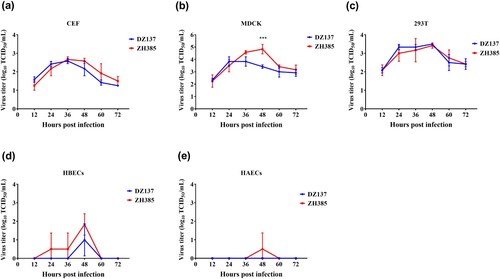
Figure 3. Replication of the H13 AIVs in 1-day-old chickens during the challenge experiments. Chickens were divided into two groups. Chickens (n = 3) and those inoculated intranasally with 50 μL of AIV H13 subtype at 106.0 EID50. (a) Viral titres in lung tissues were detected at 1, 3, and 5 dpi. (b) Viral titres in colon tissues were detected at 1, 3, and 5 dpi. The viral titres were calculated by the Reed-Muench method. The figures show the means log10EID50/g ± standard deviations (SD). The limit of virus detection was 0.75 log10EID50/g. * indicates p < 0.05, ** indicates p < 0.01, *** indicates p < 0.001.
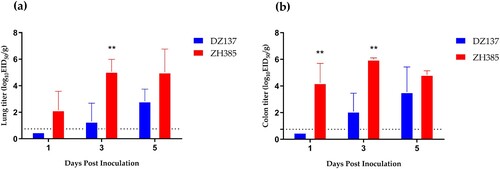
Figure 4. The 10-day-old chickens challenge experiment. Chickens were divided into two groups. Chickens (n = 3) and those inoculated intranasally with 50 μL of indicated H13 AIV at 106.0 EID50. (a) Viral titres in nasal turbinate tissues were detected at 1, 3, and 5 dpi. (b) Viral titres in tracheal tissues were detected at 1, 3, and 5 dpi. (c) Viral titres in lung tissues were detected at 1, 3, and 5 dpi. (d) Viral titres in colon tissues were detected at 1, 3, and 5 dpi. The viral titres are shown as the means log10EID50/g ± SDs. The limit of virus detection was 0.75 log10EID50/g.
Figure 5. The mouse challenge experiment. Mice were divided into three groups. Mice were inoculated intranasally with 50 μL of two H13 AIVs at 106.0 EID50. In the 3-week-old mice study, the body weight changes were recorded for 14 days, n = 5 (a). The virus titres were measured on day 3 and day 5 in the lungs (b) and nasal turbinate (c). In the 8-week-old mice study, the body weight changes were recorded, n = 5 (d). The virus replication was detected on day 3 and day 5 in the lungs (e) and nasal turbinate (f). The viral titres are shown as the means log10EID50/g ± SDs. The limit of virus detection was 0.75 log10EID50/g.
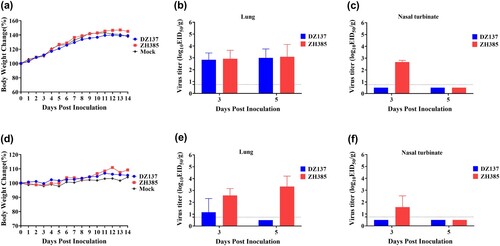
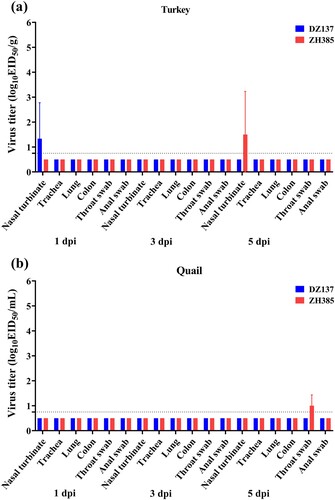
Figure 6. The turkeys and quails challenge experiment. The turkeys or quails were divided into two groups. Turkeys or quails (n = 3) were inoculated intranasally with 100 μL of indicated H13 AIV at 106.0 EID50. The nasal turbinate, trachea, lung, colon, throat swab, and anal swab were collected and titrated at 1, 3, and 5 dpi in turkeys (a) and quails (b). The viral titres are shown as the mean log10EID50/g ± SDs or log10EID50/mL ± SDs. The limit of virus detection was 0.75 log10EID50/g or 0.75 log10EID50/mL.