
Figures & data
Figure 1. COVID-19 risk-associated HLA class I alleles in South China. A) Increased frequency of HLA-A*02:07 in COVID-19 patients compared to controls. Details of each group are listed in Tables S1-3. B) Distribution of the HLA-A*0207 allele worldwide. Image from http://pypop.org/popdata. C) Sequence logo showing the amino acid preference for peptide binding to HLA-A*02:01 and A*02:07 constructed with NetMHC 4.0. A*0207 has an additional restriction on peptides with D/P at P3 resulting from the Y99C mutation in the D pocket. D-E) Predicted HLA binding of peptides with strong affinity (IC50 ≤ 100 nM) from a set of all possible 9∼14-mers from the SARS-CoV-2 proteome according to IEDB prediction. The allele frequencies (AF) of the HLA-A allele in Chinese healthy controls and COVID-19 patients are shown at the bottom. F) Allele frequencies of HLA-B alleles that were distributed significantly differently in healthy controls and COVID-19 patients with mild or severe illness. G) Sequence logo showing the amino acid preferences for peptide binding. The binding motifs were from NetMHCpan-4.0. H) Overlay of the crystal structure of the protective allele HLA-B*35:01 (blue, PDB ID: 1A1N) and the risk allele HLA-B*51:01 (pink, PDB ID: 1E27) complexed with their peptides. Structures were visualized using the PyMOL Molecular Graphics System. The peptide-binding cleft was composed of the α1 and α2 regions.
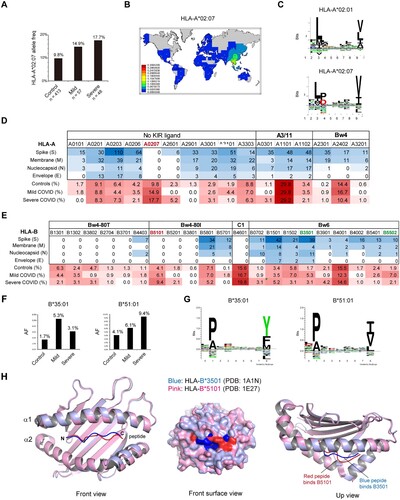
Figure 2. Preference of aromatic and large aliphatic residues at the C-termini of SARS-CoV-2 CD8 + epitopes. A) Sequence logo plot of the residues in the 8-, 9-, 10-, and 11-mer blocks of SARS-CoV-2 CD8 epitopes generated using Seq2Logo. Bits represent the relative frequencies of amino acids. B) Amino acids at the C-terminal residues of immunodominant CD8 epitopes of the spike protein and other proteins of SARS-CoV-2. C) Percentages of imunodominant CD8 epitopes that end with F/Y/W or L/V/I residues. D) Locations of F-pocket key residues in the HLA-I protein, corresponding to residues 74, 77, 80, 81, 95, 97, 114 and 116. The F-pocket residues also located in the Bw4 motif that interact with KIR are shown in red. E) Structures of the protective allele B3501 and the risk allele B5101 bound with their peptides. The structures are the same as those in H. F) Amino acid residues at the key positions within the F-pocket of some HLA-B alleles and the effects of polymorphisms on peptide binding. G) Polymorphic amino acid residue composition of HLA-B at positions 97 and 116 in the three groups.
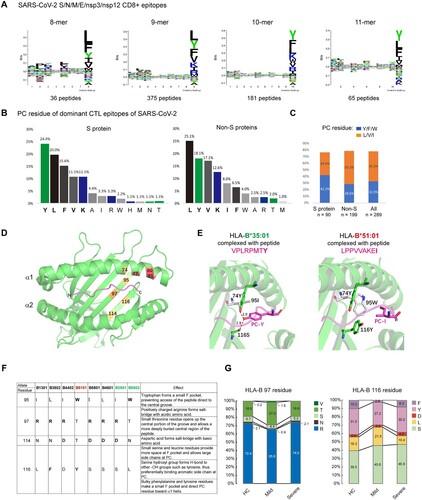
Figure 3. HLA-B alleles with Bw4 or C1 motifs bind poorly to COVID-19 peptides and do not contribute to COVID-19 severity. A) (Left) Key residues of the F-pocket and the amino acid specificities of the F- and B-pockets of HLA-B alleles classified by the KIR-binding motifs (Bw4-80 T, Bw4-80I and C1). HLA alleles that were predicted to lose SARS-CoV-2 peptide binding capacities were in gray background and were defined as weak binders, and alleles able to bind strongly to SARS-CoV-2 antigens were defined as strong binders. Residues that make contact with peptide (p), T-cell receptor (t) and killer cell immunoglobulin-like receptor (k) are indicated. (Right) Sequence logo showing the amino acid preferences for peptide binding of strong and weak binders of HLA-I with the Bw4 motif. Anchor motif of representative HLA-Bw4 alleles with predicted strong or weak binding capacities to SARS-CoV-2 peptides. Acidic (red), basic (blue), hydrophobic (black), and polar (green). The main differences between strong and weak binders lie in the P9 selectivity conferred by the F-pocket of HLA-I. The binding motifs were from NetMHCpan-4.0. B) Percentages of strong and weak binders of HLA-I with the Bw4 motif in healthy controls and COVID-19 patients with mild or severe symptoms. C) The increased HLA-B*46:01, which carries the C1 motif, was caused by linkage disequilibrium (LD) with HLA-A*02:07 in COVID-19. The HLA-B*46:01 frequency data for the deceased SARS-CoV-1 patients and controls (gray) in Taiwan are from [Citation38].
![Figure 3. HLA-B alleles with Bw4 or C1 motifs bind poorly to COVID-19 peptides and do not contribute to COVID-19 severity. A) (Left) Key residues of the F-pocket and the amino acid specificities of the F- and B-pockets of HLA-B alleles classified by the KIR-binding motifs (Bw4-80 T, Bw4-80I and C1). HLA alleles that were predicted to lose SARS-CoV-2 peptide binding capacities were in gray background and were defined as weak binders, and alleles able to bind strongly to SARS-CoV-2 antigens were defined as strong binders. Residues that make contact with peptide (p), T-cell receptor (t) and killer cell immunoglobulin-like receptor (k) are indicated. (Right) Sequence logo showing the amino acid preferences for peptide binding of strong and weak binders of HLA-I with the Bw4 motif. Anchor motif of representative HLA-Bw4 alleles with predicted strong or weak binding capacities to SARS-CoV-2 peptides. Acidic (red), basic (blue), hydrophobic (black), and polar (green). The main differences between strong and weak binders lie in the P9 selectivity conferred by the F-pocket of HLA-I. The binding motifs were from NetMHCpan-4.0. B) Percentages of strong and weak binders of HLA-I with the Bw4 motif in healthy controls and COVID-19 patients with mild or severe symptoms. C) The increased HLA-B*46:01, which carries the C1 motif, was caused by linkage disequilibrium (LD) with HLA-A*02:07 in COVID-19. The HLA-B*46:01 frequency data for the deceased SARS-CoV-1 patients and controls (gray) in Taiwan are from [Citation38].](/cms/asset/9bf86309-907c-4a8b-b835-25c5a2523c53/temi_a_2185467_f0003_oc.jpg)
Figure 4. Distributions of four epitopes of HLA-A, HLA-B and HLA-C that interact with human killer cell immunoglobulin-like receptors (KIRs) in Chinese healthy controls and COVID-19 patients. A) Pie charts of the distributions of HLA class I epitopes that interact with KIRs in healthy controls and COVID-19 patients with mild or severe illness. The Bw4 epitope (residues 77, 80-83) is present in some HLA-A and HLA-B allotypes. Bw4 motifs are further divided into 80I (isoleucine; dark green) and 80 T (threonine; light green) motifs according to the amino acid at position 80. The C1 motif carried by HLA-B allotypes was introduced by B*46:01 in Asians. Allotypes that are not KIR ligands are in gray. B) Reduced Bw4-80I and Bw4-80 T at HLA-A and HLA-B allotypes in COVID-19 severe patients. C) Copy numbers of the Bw4 motif present at HLA-A and HLA-B (B-Bw4-80 T, B-Bw4-80I and A-Bw4) allotypes in KIR3DL1-positive individuals. D) Associations of KIR, HLA ligand genotypes and KIR + HLA combinations in mild or severe COVID-19. Odds ratios (ORs) and 95% confidence intervals (CIs) are shown.
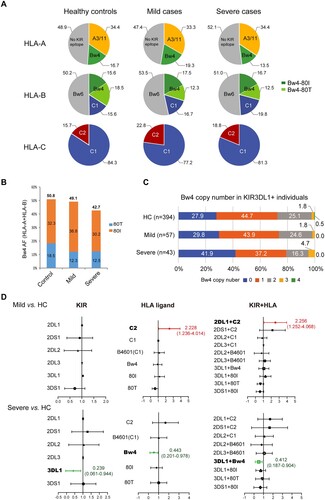
Figure 5. SARS-CoV-2 ORF8 downregulates surface HLA-I and activates NK cells. A) 293 T or B) Akata Burkitt lymphoma cells were transfected with pCDH-copGFP plasmids encoding different viral immune evasion genes. At 48 h posttransfection, surface HLA-I was stained with APC-conjugated W6/32 mAb, and HLA-II was stained with PE-conjugated Tü39 mAb (in Akata only) gated on GFP+ cells. Black: transfected with vector, orange: transfected with SARS-CoV ORF8, red: transfected with SARS-CoV2 ORF8, green: transfected with EBV BNLF2a, and blue: transfected with EBV BILF1. The gray histogram denotes background staining obtained with an isotype control antibody. C) Downregulation of HLA-A, -B and -C by viral proteins. Flow cytometry staining of HLA-A (A2), HLA-B (Bw4) or HLA-C using the locus-specific mAbs is shown for transfected cells and an isotype control (grey). 293 T cells were selected to detect the regulation on HLA-A2, Akata cells were used to detect the regulation on HLA-B Bw4 and HLA-C. D) NK cells activation determined by NK cells degranulation assay. Akata as target cells were incubated with PBMCs of a representative healthy donor as effector cells, both target and effector cells were heterogenous for HLA-A Bw4 80I and HLA-B Bw4-80I, and homozygous for HLA-C1. Flow cytometry determined CD107a expression on the CD56+ cell surfaces following stimulation of Akata cells transfected with empty vector, ORF8 of SARS-CoV-1 and −2, EBV proteins BNLF2a and BILF1, or with K562 cells, or with PMA/ionomycin (E:T ratio 20:1). The histogram shows the mean fluorescence intensity (MFI) of surface CD107a expression on NK cells (gated on CD56+/ CD19-). Representative data are shown from three independent experiments, statistical significance was assessed by one-way ANOVA with Dunnett t multiple-comparison test. Data are depicted as the mean ± s.d.
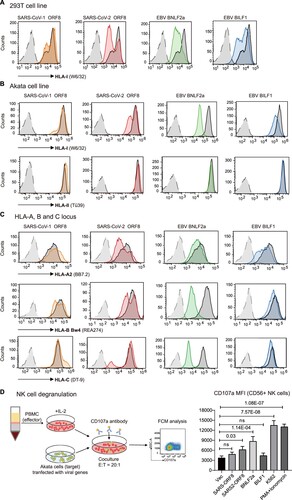
Figure 6. Distribution of the HLA-Bw4 motif in healthy controls and deceased COVID-19 patients in Russia [Citation10]. A) Pie charts of the distributions of HLA class I epitopes that interact with KIRs in Russian healthy controls (n = 428) and deceased COVID-19 patients (n = 111). The source data were from [Citation10]. B) Allele frequencies of the Bw4 motif in HLA-A and HLA-B allotypes in controls and deceased COVID-19 patients in Russia. C) Distributions of weak binder (WB) and strong binder (SB) of HLA-B and HLA-A alleles in controls and deceased COVID-19 patients. D) Copy numbers of the Bw4 motif present at HLA-A and HLA-B alleles (B-Bw4-80 T, B-Bw4-80I and A-Bw4) in Russian controls and deceased COVID-19 patients. E) Percentages of KIR genes as receptors for HLA-Bw4, HLA-C1 and C2 allotypes in Russians and Chinese. Data of Russian KIR gene frequencies were pooled from 6 populations in Russia with a total of 384 individuals from www.allelefrequencies.net. Chinese KIR gene frequencies were from this study (n = 413).
![Figure 6. Distribution of the HLA-Bw4 motif in healthy controls and deceased COVID-19 patients in Russia [Citation10]. A) Pie charts of the distributions of HLA class I epitopes that interact with KIRs in Russian healthy controls (n = 428) and deceased COVID-19 patients (n = 111). The source data were from [Citation10]. B) Allele frequencies of the Bw4 motif in HLA-A and HLA-B allotypes in controls and deceased COVID-19 patients in Russia. C) Distributions of weak binder (WB) and strong binder (SB) of HLA-B and HLA-A alleles in controls and deceased COVID-19 patients. D) Copy numbers of the Bw4 motif present at HLA-A and HLA-B alleles (B-Bw4-80 T, B-Bw4-80I and A-Bw4) in Russian controls and deceased COVID-19 patients. E) Percentages of KIR genes as receptors for HLA-Bw4, HLA-C1 and C2 allotypes in Russians and Chinese. Data of Russian KIR gene frequencies were pooled from 6 populations in Russia with a total of 384 individuals from www.allelefrequencies.net. Chinese KIR gene frequencies were from this study (n = 413).](/cms/asset/917b3d2b-94fe-45e1-8899-ad53bfca281a/temi_a_2185467_f0006_oc.jpg)
Figure 7. HLA class I as KIR ligands in different populations. A) Pie charts showing the frequency spectra for HLA class I alleles that interact with KIRs in different ethnic populations. The A3/11 epitope is carried by HLA-A3 and HLA-A11; the Bw4 epitope is encoded by subsets of HLA-A and HLA-B alleles; and the C1 epitope present in HLA-B is carried by HLA-B*46 and HLA-B*73. Gray pie segments represent allotypes that are not KIR ligands. N denotes the population size. B) Percentages of HLA-B alleles carrying the Bw4 motif that are predicted to interact with SARS-CoV-2 peptides with strong or weak affinities. Data of non-Chinese populations except Russia (n = 428) [Citation10] were from http://allelefrequencies.net/. The prevalence of HLA-Bw4 allotypes as poor binders for coronaviruses in certain areas might be a result of historical competition between NK- and T-cell-mediated immunity against epidemics of infectious diseases.
![Figure 7. HLA class I as KIR ligands in different populations. A) Pie charts showing the frequency spectra for HLA class I alleles that interact with KIRs in different ethnic populations. The A3/11 epitope is carried by HLA-A3 and HLA-A11; the Bw4 epitope is encoded by subsets of HLA-A and HLA-B alleles; and the C1 epitope present in HLA-B is carried by HLA-B*46 and HLA-B*73. Gray pie segments represent allotypes that are not KIR ligands. N denotes the population size. B) Percentages of HLA-B alleles carrying the Bw4 motif that are predicted to interact with SARS-CoV-2 peptides with strong or weak affinities. Data of non-Chinese populations except Russia (n = 428) [Citation10] were from http://allelefrequencies.net/. The prevalence of HLA-Bw4 allotypes as poor binders for coronaviruses in certain areas might be a result of historical competition between NK- and T-cell-mediated immunity against epidemics of infectious diseases.](/cms/asset/56b71e05-7e7b-4345-a190-c120283ead63/temi_a_2185467_f0007_oc.jpg)
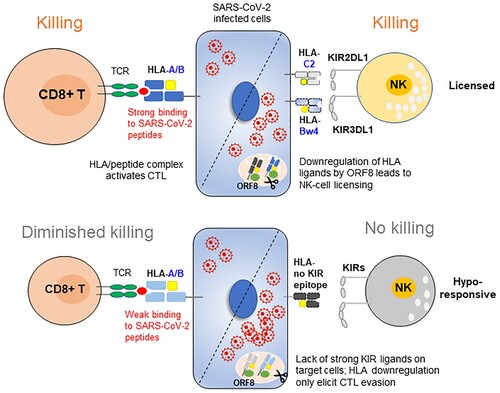
Figure 8. Working model. In individuals with immune protection against SARS-CoV-2, CTLs play a dominant role in eliminating viral infection. When the viral load is low and HLA-I is normally expressed, CTLs play a dominant role in destroying the infected cells; upon viral replication and SARS-CoV-2 ORF8-induced HLA-I degradation, the strong interaction of HLA-C2 ligands and KIR2DL1 promotes NK cell activation. In contrast, in individuals who are prone to develop severe symptoms, their HLA genotypes did not have viral peptide presentation advantages, and their NK cells are missing inhibitory KIR3DL1 and HLA-Bw4 interactions and are hyporesponsive against the high titre of SARS-CoV-2, which causes HLA-I degradation and CTL evasion.
Supplemental Material
Download Zip (117.1 KB)Data availability statement
We are happy to share reagents and information in this study upon request.