Figures & data
Table 1. Clinical history of red foxes, skunks and mink naturally infected with various HPAI H5N1 viruses.
Figure 1. Phylogenetic relationships of highly pathogenic H5N1 viruses of clade 2.3.4.4b. Green branches on the phylogenies represent North American lineage low pathogenic IAVs collected in North America between 2017 and 2021, while black branches denote highly pathogenic H5N1 viruses of clade 2.3.4.4b collected in Europe between October 2020 and November 2021. Highly pathogenic H5N1 viruses of clade 2.3.4.4b collected in Canada between November 2021 and July 2022 are colour coded as follows: yellow = pattern 1 viral genome; magenta = pattern 2 viral genome; cyan = pattern 3 viral genome; and blue = pattern 4 viral genome. Horizontal branch lengths are drawn to scale (nucleotide substitutions per site). Each segment tree is mid-point rooted except for segments HA, NA, and M which are rooted with the oldest sequences in the database.
Figure 2. The genome composition and reassortment patterns of HPAI H5N1 (clade 2.3.4.4b) viruses. Virus sequences were obtained from three mesocarnivore species (red foxes, striped skunks, and mink) in Canada in 2022.
Figure 3. MCC tree inferred using Bayesian MCMC analysis of concatenated full genome sequences of H5N1 clade 2.3.4.4b viruses obtained from mesocarnivores and birds. The clustering evidence of the viruses on the phylogenetic tree demonstrates the genetic relatedness of viruses from red fox, skunks, and mink with avian-origin H5N1 within a specific North American wild bird migration flyways. Branches are highlighted to reflect North American bird migration flyways: yellow for Atlantic flyway; pink for Mississippi flyway; and light green for Central flyway. AB = Alberta; MB = Manitoba; SK = Saskatchewan; ON = Ontario; PEI = Prince Edward Island; NS = Nova Scotia.
Figure 4. Map describing the geographic location of HPAI H5N1 clade 2.3.4.4b virus obtained from individual mesocarnivore, wild and domestic birds in Canada in 2021/2022. It illustrates viruses with similar reassortment patterns circulating in both mammals, and wild and domestic birds in the exact geographic location. Each shape was plotted on the map based on the exact longitude and latitude coordinates where the animals were found and were plotted on a cartographic boundary shapefile containing the existing provinces and territories of Canada using R programming. H5N1 viruses with the same reassortment pattern circulating in different animals are described using the same colour.
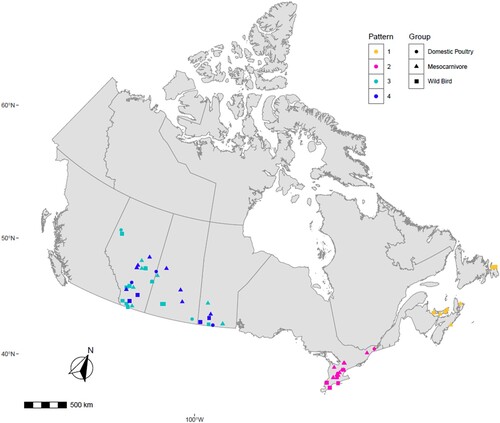
Table 2. Amino acid substitution in the H5N1 viruses associated with adaptation to mesocarnivore species.
Figure 5. Histopathology and immunohistochemical findings in the brain tissue from a red fox. A. Multifocal areas of necrotizing encephalitis (low magnification, circled). B. Abundant influenza virus antigen (brown deposition) corresponding to areas of inflammation observed in slide A. C. Degeneration of neurons with neutrophil infiltration (circled) and perivascular cuffing with inflammatory cells (black arrow). Inset: Multiple pale eosinophilic neurons with karyolytic nuclei indicating degeneration and presence of neutrophils. D. Abundant viral antigen was detected and corresponds with histologic lesions observed in slide C (red arrows). E. Meningitis (arrow) and areas of increased cellularity due to gliosis and inflammatory cells infiltrate (*). Inset: Neuronophagia. F. Abundant viral antigen in the brain corresponding to areas of inflammation shown in E. G. Vasculitis (arrows). H. Viral antigen detected in endothelial cells (arrow).
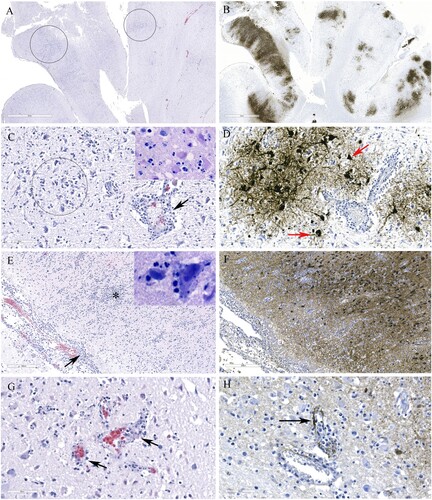
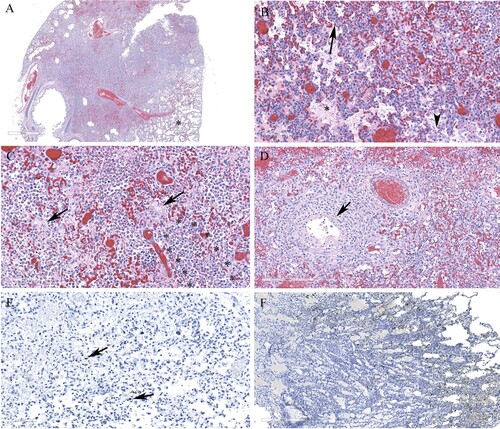
Figure 6. Histopathology and immunohistochemical findings in lung sections from a red fox. A. Extensive pneumonia leading to loss of alveolar spaces. Relatively normal tissue indicated by asterisk (*). B. Interstitial infiltration of inflammatory cells (arrow), alveolar edema (*), increased alveolar macrophages (arrowhead). C. Alveolar spaces contain fibrin (arrows) and neutrophils (outlined by asterisks). D. Necrotizing bronchiolitis (arrow). E. Only occasional cells contain viral antigens from Manitoba samples (arrows). F. Abundant viral antigen detected in a red fox lung sections from Ontario (brown deposits).