Figures & data
Figure 1. Overview of immunological changes induced by BBIBP-CorV vaccination. A. Workflow of vaccination, sampling and scRNA-seq. B. UMAP charts of 263,624 single cells coloured according to cell type. C. Violin plot showing the expression of signature genes in the 12 cell types. D. Box charts showing the proportion of each cell type in total PBMCs of each sample across four groups (n = 9 in BV group, n = 6 in the 1V7, 2V7 and 2V14 groups). All box plots display the median, 25th and 75th percentiles, and whiskers extending to the maximum and minimum data points. Data were analyzed by an unpaired Mann-Whitney U-test. A p value < 0.05 was considered statistically significant. E. Measurement of anti-recombinant S-RBD neutralizing antibodies across the four groups (n = 6 in the BV, 1V7, 2V7 and 2V14 groups). Serum was diluted 55 times for IgG. S-RBD, receptor binding domain of spike protein. F. Fraction of cells expressing IL2 and IL4 in BV group (n = 9), 1V7 group (n = 6), 2V7 group (n = 6) and 2V14 group (n = 6). All box plots display the median, 25th and 75th percentiles, and whiskers extending to the maximum and minimum data points. Data were analyzed by an unpaired Mann–Whitney U-test. A p value< 0.05 was considered statistically significant. Conv, convalescent patients. Mega, megakaryocytes. S-RBD, Spike receptor binding domain. BV group, before vaccination. 1V7 group, 7 days after the first vaccination. 2V7 group, 7 days after the second vaccination. 2V14 group, 14 days after the second vaccination.
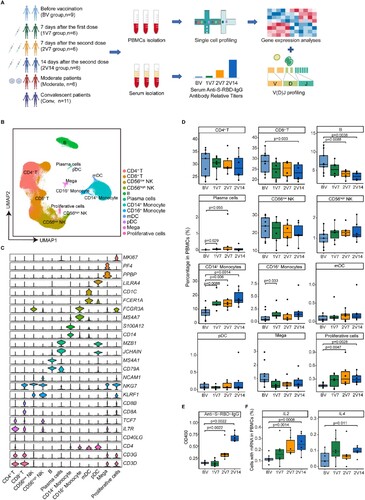
Figure 2. Characterization of innate immune cells after BBIBP-CorV vaccination. A and B. UMAP plots showing the innate immune cells in total (A) and in the four groups separately (B). Each dot corresponds to a single cell. Cells are coloured according to cell type. C. Scatter-plot showing DEGs in CD14+ monocytes of the 2V7 and 2V14 groups compared with those in the BV group. Each red dot denotes an individual gene with Log2FC ≥ 0.4 and adjusted p value < 0.05 for the 2V7/BV and 2V14/BV comparisons. D. Functional enrichment analyses of the DEGs coloured in red in the scatter-plot in C. The top 30 enriched BP terms are shown. Interesting BP terms are highlighted in red. E. Scatter-plot showing DEGs in CD16+ monocytes of the 2V7 and 2V14 groups compared with those in the BV group. Each red dot denotes an individual gene with Log2FC ≥ 0.4 and adjusted p value < 0.05 for the 2V7/BV and 2V14/BV comparisons. F. Functional enrichment analyses of the DEGs coloured in red in the scatter-plot in E. The top 30 enriched BP terms are shown. Interesting BP terms are highlighted in red. G. Box plots showing the expression of the type I interferon production pathway across innate immune cells derived from BV group (n = 9), 1V7 group (n = 6), 2V7 group (n = 6) and 2V14 group (n = 6). Groups are shown in different colours. All box plots display the median, 25th and 75th percentiles, and whiskers extending to the maximum and minimum data points. Data were analyzed by an unpaired Mann-Whitney U-test. A p value< 0.05 was considered statistically significant. DEGs, differentially expressed genes. FC, fold change. BP, biological process. BV group, before vaccination. 1V7 group, 7 days after the first vaccination. 2V7 group, 7 days after the second vaccination. 2V14 group, 14 days after the second vaccination.
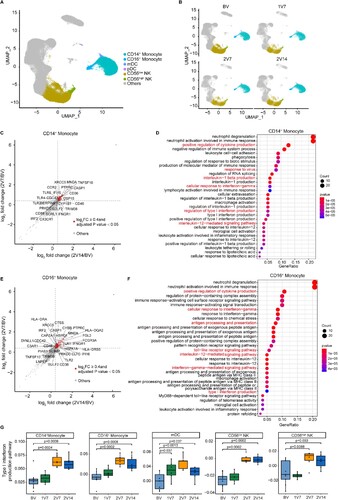
Figure 3 . Characterization of T cells after BBIBP-CorV vaccination. A. UMAP plot showing the T cells coloured according to cell subsets. B. Violin plots showing the expression of signature genes in 15 T cell subsets. C. Box plots showing the proportion of each T cell subset in total T cells of each sample across four groups (n = 9 in BV group, n = 6 in the 1V7, 2V7 and 2V14 groups). Groups are shown in different colours. All box plots display the median, 25th and 75th percentiles, and whiskers extending to the maximum and minimum data points. Data were analyzed by an unpaired Mann-Whitney U-test. A p value< 0.05 was considered statistically significant. D. Scatter-plot showing the DEGs in CD4+ T cells of the 2V7 and2V14 groups compared with those in the BV group. Each red dot denotes an individual gene with Log2FC ≥ 0.4 and adjusted p value < 0.05 for the 2V7/BV and 2V14/BV comparisons. E. Functional enrichment analyses of the DEGs coloured in red in the scatter-plot in D. The top 30 enriched BP terms are shown. Interesting BP terms are highlighted in red. F. Box plots showing the expression of the T cell receptor signalling pathway across CD4+ T cell subsets derived from BV group (n = 9), 1V7 group (n = 6), 2V7 group (n = 6) and 2V14 group (n = 6). Groups are shown in different colours. All box plots display the median, 25th and 75th percentiles, and whiskers extending to the maximum and minimum data points. Data were analyzed by an unpaired Mann-Whitney U-test. A p value< 0.05 was considered statistically significant. G. GSEA enrichment plots showing two upregulated gene sets in CD4+ T cells of the 2V14 group compared with those in the BV group. NES, normalized enrichment score. A p value < 0.05 was considered statistically significant. DEGs, differentially expressed genes. FC, fold change. BP, biological process. BV group, before vaccination. 1V7 group, 7 days after the first vaccination. 2V7 group, 7 days after the second vaccination. 2V14 group, 14 days after the second vaccination.
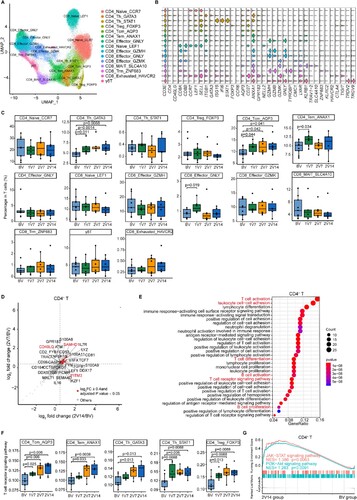
Figure 4. Global profile of the CDR3 length of T cell clones and TCR VJ distribution after BBIBP-CorV vaccination. A and B. Bar plots showing the distribution of CDR3 amino acid lengths for the TCR α chain (A) and TCR β chain (B) across the four groups (n = 9 in BV group, n = 6 in the 1V7, 2V7 and 2V14 groups). C-F. Bar plot showing the usage of some TRAV genes (C), TRAJ genes (D), TRBV genes (E) and TRBJ genes (F) across the four groups (n = 9 in BV group, n = 6 in the 1V7, 2V7 and 2V14 groups). Error bars represent ± s.e.m. Data were analyzed by an unpaired Mann-Whitney U-test. A p value< 0.05 was considered statistically significant. G. Heatmap showing the usage of significantly differentially-expressed V-J gene pairs of the TCR α and TCR β chains across the four groups. Red, high expression; blue, low expression. CDR3, complementarity determining region 3. BV group, before vaccination. 1V7 group, 7 days after the first vaccination. 2V7 group, 7 days after the second vaccination. 2V14 group, 14 days after the second vaccination.
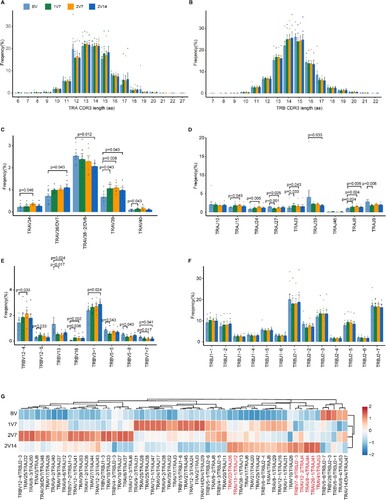
Figure 5. Clonal expansion of CD4+ T cells after BBIBP-CorV vaccination. A. Bar plot showing the distribution of CD4+ T cell clone sizes across the four groups (left panel). Box plot showing the proportions of CD4+ T cells with 2–5 times clonal expansion among the total CD4+ T cells across the four groups (n = 9 in BV group, n = 6 in the 1V7, 2V7 and 2V14 groups) (right panel). All box plots display the median, 25th and 75th percentiles, and whiskers extending to the maximum and minimum data points. Data were analyzed by an unpaired Mann-Whitney U-test. A p value< 0.05 was considered statistically significant. B. Box plots showing the clone diversity of expanded T cell subsets across the four groups (n = 9 in BV group, n = 6 in the 1V7, 2V7 and 2V14 groups). The percentage of TCR classification count (the number of different TCR sequences in a sample) to the total cell number was used to indicate TCR diversity. All box plots display the median, 25th and 75th percentiles, and whiskers extending to the maximum and minimum data points. Data were analyzed by an unpaired Mann-Whitney U-test. A p value< 0.05 was considered statistically significant. C. Volcano plot showing the DEGs in the expanded CD4+ T cells (clone size ≥ 2) in the 2V14 group compared with the BV group. Example genes are labelled with gene names. Red, upregulated in the 2V14 group (Log2FC ≥ 0.4, adjusted p value < 0.05); blue, downregulated in the 2V14 group (Log2FC≤−0.4, adjusted p value < 0.05). D. Functional enrichment analysis of upregulated DEGs in clonal expanded CD4+ T cells of the 2V14 group compared with the BV group. The top 30 enriched BP terms are shown. Interesting BP terms are highlighted in red. E. GSEA enrichment plots showing five upregulated gene sets in the clonal expanded CD4+ T cells of 2V14 group compared with those in the BV group. NES, normalized enrichment score. A p value< 0.05 was statistically significant. F. Heatmap showing the inferred significantly differentially-expressed TF regulons between the 2V14 and BV groups. Numbers between brackets represent the regulon counts for respective transcription factors. Red, high expression; blue, low expression. G. Box plots showing the area under the curve of STAT1(940 g), STAT4 (14 g) and STAT6 (56 g) in the clonal expanded CD4+ T cells derived from BV group (n = 9), 1V7 group (n = 6), 2V7 group (n = 6) and 2V14 group (n = 6). Groups are shown in different colours. Numbers between brackets represent the regulon counts for respective transcription factors. All box plots display the median, 25th and 75th percentiles, and whiskers extending to the maximum and minimum data points. Data were analyzed by an unpaired Mann-Whitney U-test. A p value< 0.05 was considered statistically significant. DEGs, differentially expressed genes. FC, fold change. BP, biological process. BV group, before vaccination. 1V7 group, 7 days after the first vaccination. 2V7 group, 7 days after the second vaccination. 2V14 group, 14 days after the second vaccination.
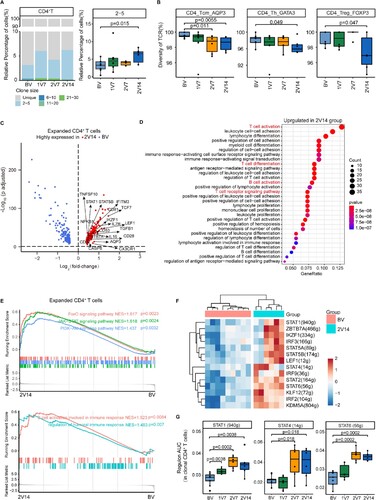
Figure 6. Immunological features of B cell subsets after BBIBP-CorV vaccination. A. UMAP plot showing the B/plasma cells coloured according to cell subset. B. Violin plots showing expression of signature genes in five B cell subsets. C. Box plots showing the proportion of each B cell subset in total B/plasma cells of each sample across four groups (n = 9 in BV group, n = 6 in the 1V7, 2V7 and 2V14 groups). All box plots show the median, 25th and 75th percentiles. Data were analyzed by an unpaired Mann-Whitney U-test. A p value< 0.05 was considered statistically significant. D. Scatter-plot showing DEGs in the B/plasma cells of the 2V7 and 2V14 groups compared with those in the BV group. Each red dot denotes an individual gene with Log2FC ≥ 0.4 and an adjusted p value < 0.05 for the 2V7/BV and 2V14/BV comparisons. E. Functional enrichment analysis of the DEGs coloured in red in the scatter-plot in D. The top 30 enriched BP terms are shown. Interesting BP terms are highlighted in red. F. Box plots showing the expression of the immunoglobulin production pathway across B cell subsets derived from BV group (n = 9), 1V7 group (n = 6), 2V7 group (n = 6) and 2V14 group (n = 6). Groups are shown in different colours. All box plots display the median, 25th and 75th percentiles, and whiskers extending to the maximum and minimum data points. Data were analyzed by an unpaired Mann-Whitney U-test. A p value< 0.05 was considered statistically significant. DEGs, differentially expressed genes. FC, fold change. BP, biological process. BV group, before vaccination. 1V7 group, 7 days after the first vaccination. 2V7 group, 7 days after the second vaccination. 2V14 group, 14 days after the second vaccination.
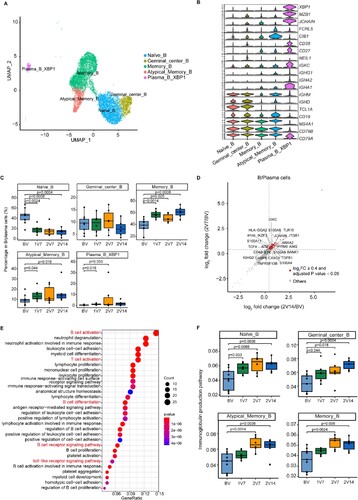
Figure 7. Global profile of the CDR3 length of B cell clones and BCR VJ distribution after BBIBP-CorV vaccination. A and B. Bar plots showing the distribution of amino acid lengths of CDR3 for the BCR heavy chain (A) and BCR light chain (B) across the four groups (n = 9 in BV group, n = 6 in the 1V7, 2V7 and 2V14 groups). Error bars represent ± s.e.m. Data were analyzed by an unpaired Mann-Whitney U-test. A p value< 0.05 was considered statistically significant. C-F. Bar plot showing the usage of IGHV genes (C), IGHJ genes (D), IGKV/LV genes (E) and IGKJ/LJ genes (F) across the four groups (n = 9 in BV group, n = 6 in the 1V7, 2V7 and 2V14 groups). Error bars represent ± s.e.m. Data were analyzed by an unpaired Mann–Whitney U-test. A p value< 0.05 was considered statistically significant. G. Heatmap showing the usage of significantly differentially-expressed V-J gene pairs of the BCR heavy and light chains across the four groups (n = 9 in BV group, n = 6 in the 1V7, 2V7 and 2V14 groups). Red, high expression; blue, low expression. H. Box plots showing the UMI percentages of IGHD, IGHA, IGHG and IGHM in B/plasma cells across the four groups (n = 9 in BV group, n = 6 in the 1V7, 2V7 and 2V14 groups). All box plots display the median, 25th and 75th percentiles, and whiskers extending to the maximum and minimum data points. Data were analyzed by an unpaired Mann-Whitney U-test. A p value< 0.05 was considered statistically significant. CDR3, complementarity determining region 3. BV group, before vaccination. 1V7 group, 7 days after the first vaccination. 2V7 group, 7 days after the second vaccination. 2V14 group, 14 days after the second vaccination.
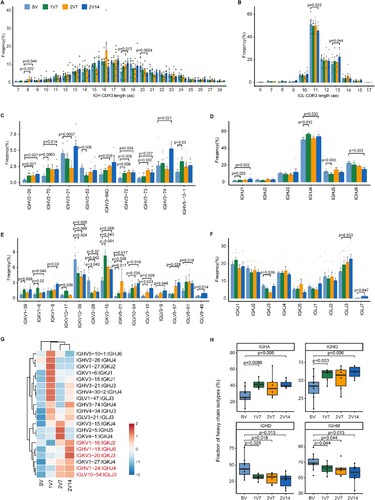
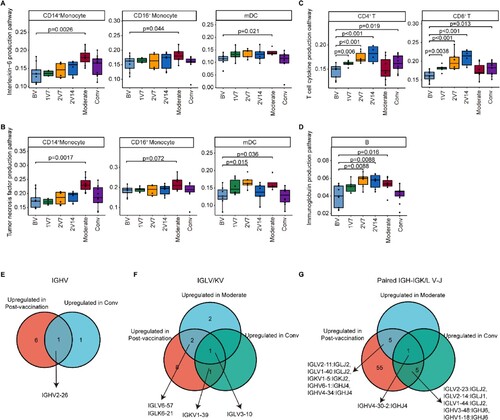
Figure 8. Comparison of the immunological features induced by BBIBP-CorV vaccination and SARS-CoV-2 infection. A and B. Box plots showing the expression of the interleukin-6 production pathway (A) and the tumour necrosis factor production pathway (B) in CD14+ monocytes, CD16+ monocytes and mDCs derived from the BV group (n = 9), 1V7 group (n = 6), 2V7 group (n = 6), 2V14 group (n = 6), moderate group (n = 6) and conv group (n = 11). Groups are shown in different colours. All box plots display the median, 25th and 75th percentiles, and whiskers extending to the maximum and minimum data points. Data were analyzed by an unpaired Mann–Whitney U-test. A p value< 0.05 was considered statistically significant. C. Box plots showing the expression of the T cell cytokine production pathway in CD4+ and CD8+ T cells derived from the BV group (n = 9), 1V7 group (n = 6), 2V7 group (n = 6), 2V14 group (n = 6), moderate group (n = 6) and conv group (n = 11). Groups are shown in different colours. All box plots display the median, 25th and 75th percentiles, and whiskers extending to the maximum and minimum data points. Data were analyzed by an unpaired Mann-Whitney U-test. A p value< 0.05 was considered statistically significant. D. Box plots showing the expression of the immunoglobulin production pathway in B cells derived from the BV group (n = 9), 1V7 group (n = 6), 2V7 group (n = 6), 2V14 group (n = 6), moderate group (n = 6) and conv group (n = 11). Groups are shown in different colours. All box plots display the median, 25th and 75th percentiles, and whiskers extending to the maximum and minimum data points. Data were analyzed by an unpaired Mann-Whitney U-test. A p value< 0.05 was considered statistically significant. E. Venn diagrams showing the upregulated IGHV gene numbers for the post-vaccination and conv groups compared with the BV group. F. Venn diagrams similar to E, but for the IGKV/LV gene in the post-vaccination, moderate and conv groups. G. Venn diagrams similar to F, but for the V-J gene pairs for the BCR heavy and light chains. To be considered upregulated post-vaccination, the genes had to be upregulated in at least one of the three groups (1V7, 2V7 or 2V14). Conv, convalescent patients. BV group, before vaccination. 1V7 group, 7 days after the first vaccination. 2V7 group, 7 days after the second vaccination. 2V14 group, 14 days after the second vaccination.