Figures & data
Table 1. Demographic characteristics of patients with hand, foot, and mouth disease (HFMD) included in the study.
Figure 1. Bacterial composition of gut microbiota in patients with hand, foot, and mouth disease (HFMD). (a) Principal coordinate analysis of patients with mild and severe HFMD. For patients with severe HFMD, samples collected at acute and convalescent phases are included. Distribution of the predominant bacteria at phylum (b), family (c), and genus levels (d) are shown.
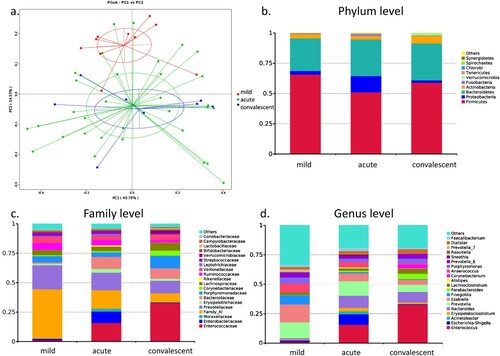
Figure 2. Alpha-diversity of gut microbiota in patients with mild and severe HFMD. For patients with severe HFMD, samples collected at the acute and convalescent phases are included. (a–e) Observed species, Chao 1, Abundance-based Coverage Estimator (ACE), Shannon index, and Simpson index, respectively. Statistically significant differences between the two groups are marked, and * indicates p < 0.05.
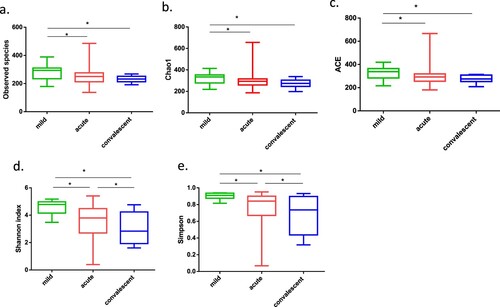
Figure 3. Gut bacterial composition of each sample. (a) Gut bacterial compositions of each sample at the genus level. (b) Tree based on weighted UniFrac distances of each sample at phylum level. Different coloured arrows represent different predominant bacteria, corresponding to different groups.
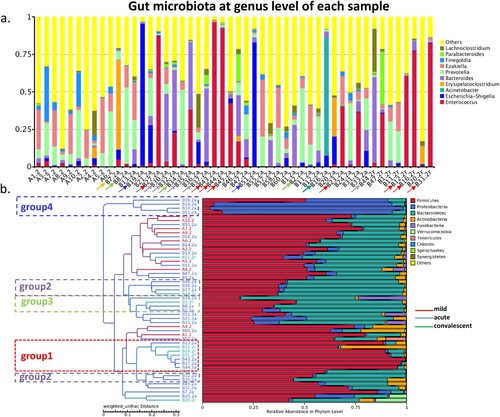
Figure 4. Bacterial composition of oropharyngeal microbiota in patients with hand, foot, and mouth disease (HFMD). (a) Principal coordinate analysis of patients with mild and severe HFMD. For patients with severe HFMD, samples collected at the acute and convalescent phases are included. Distribution of the predominant bacteria at the phylum (b), family (c), and genus levels (d) are shown.
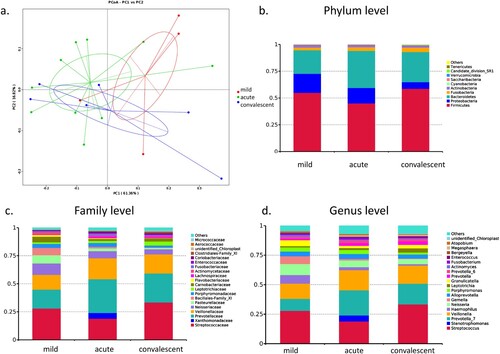
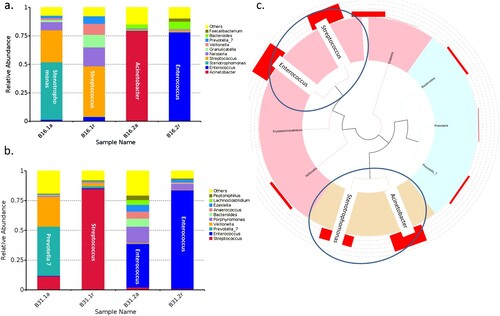
Figure 5. Oropharyngeal bacterial composition of each sample. (a) Bacterial composition of each sample at the genus level. (b) Tree based on weighted UniFrac distances of each sample at phylum level. Different coloured arrows represent different predominant bacteria, corresponding to different groups.
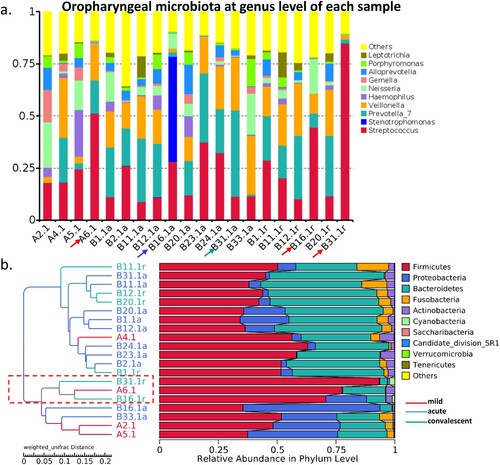
Figure 6. Example of the predominant bacteria carried by patients B16 and B31. (a) The predominant bacteria carried by patients B16 and B31 in the gut and oropharynx at acute and convalescent phases. (b) Phylogenetic tree of the predominant bacteria carried by the two patients.