Figures & data
Table 1. Immune protection efficacy determination.
Figure 1. Levels of PT-IgG and FHA-IgG in different strains of mice after immunization. (A) and (B) represent the levels of PT-IgG and FHA-IgG in each strain of mice after immunization; * indicates P < .05, ** indicates P < .01. Sample size: n = 10. The antibody titre is represented by geometric mean and standard deviation.
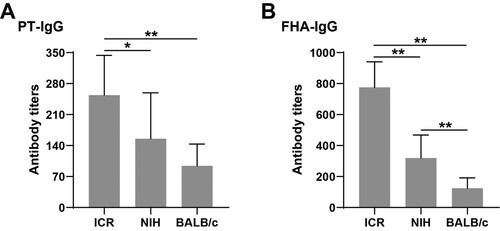
Figure 2. Changes of T cell subsets in three strains of mice before and after immunization. The results of (A), (B), and (C) are the changes of T cell subsets in ICR, NIH, and BALB/c mice before and after immunization, receptively. * indicates P < .05, ** indicates P < .01. Sample size: n = 10.
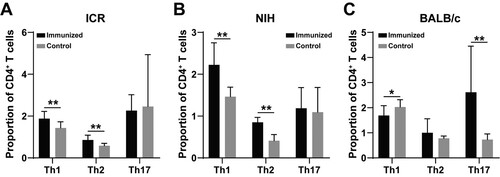
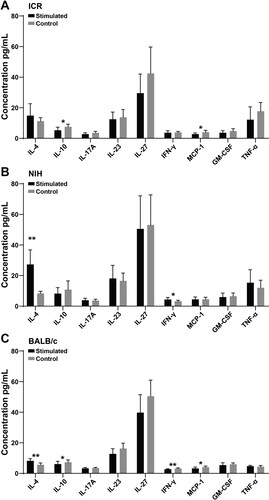
Figure 3. Changes of cytokines in three strains of mice after PT antigen stimulation. (A), (B), and (C) represent the changes of cytokines in ICR, NIH, and BALB/c mice after PT stimulation. * indicates P < .05, ** indicates P < .01. Sample size: n = 10.
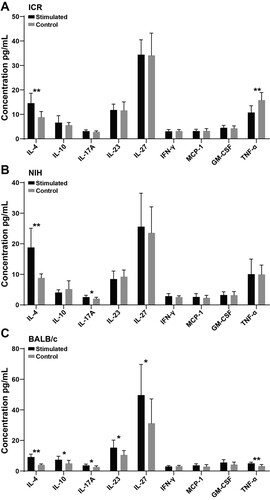
Figure 4. Changes of cytokines in three strains of mice after FHA stimulation. (A), (B), and (C) represent the changes of cytokines in ICR, NIH, and BALB/c mice after FHA stimulation. * indicates P < .05, ** indicates P < .01. Sample size: n = 10.