
Figures & data
Figure 1. Number of cases MPV reported through time in U.S. The graphic refers 27,632 cases reported of MPV by May to October, 2022 in U.S. The green colour represents the sampling period.
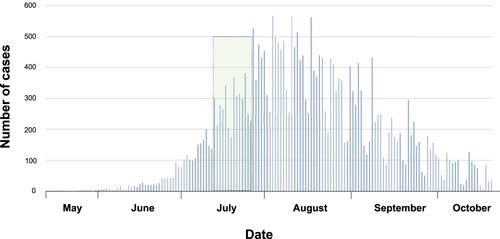
Table 1. Data of the samples subjected to sequencing analysis.
Figure 2. Phylogenetic relationship of MPV genomes in the global context. (A) Maximum likelihood tree from whole genome SNPs for the 674 genomes sequences analyzed. Each colour represent the three different clusters of MPV described so far (I, IIa and IIb). A magnification of the cluster IIb (to visualize the 23 genomes included in this study) was included. The green dots represent the samples from patients and the red dots the samples from cell culture. The figure shows the identification of each paired sample with their respective connection between direct sample and culture (lines) and highlight in red whose paired sample with differences between them. (B) Maximum likelihood tree highlighting the sub-lineages B.1 identified in this study. Each colour into the tree represents a different sub-lineage; the red lines show the position of the 16 genomes mapped into five different sub-lineages B.1.
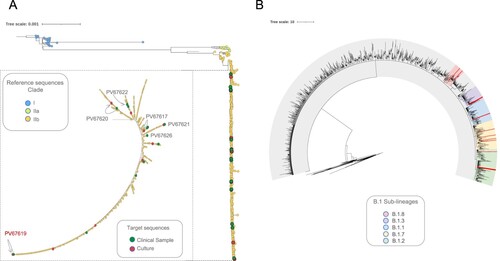
Figure 3. SNP characterization between 23 genomes analyzed. Single nucleotide polymorphisms (SNP) found in the 23 MPV isolates (Genome ID) compared with the reference sequence (NC_063383.1). The purple colour represents the non-synonymous substitution (NSS) shared in more than 90% of genomes analyzed, and the grey colour the NSS shared between CS-CPS samples or found in just some genomes.* represents the identification of a N in that position. The colours located in the bottom of the figure represent the function in which have been associated the ORF.
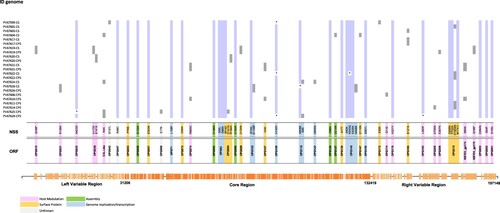
Figure 4. Nucleotide diversity between 23 genomes analyzed. The colours represent the SNPs found throughout MPV genome, to compare the 23 samples included in the study with the reference sequence (NC_063383.1). We observed a major representation in the GA > AA and TC > TT substitutions.
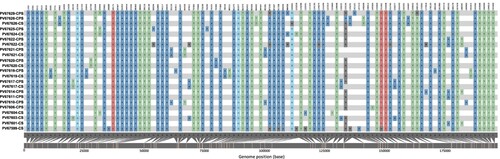
Table 2. SNPs identified with GA > AA and TC > TT nucleotide replacements shared between the different lineages.