
Figures & data
Figure 1. SARS-CoV-2 pseudovirus infects human intestinal monolayers and disrupts intestinal barrier integrity. (A) ACE2 expression (green) in human intestinal tissue, determined by fluorescence microscopy. Nuclei (DAPI) are shown in blue. Scale bar = 166 micron. Representative of n = 2. (B) ACE2-positive cells in 3D organoid cultures derived from human intestinal tissue, determined by flow cytometry. Representative of n = 3. (C) Graphical representation of the intestinal organoid monolayer infection model, including representative confocal images of a top view and side view of the monolayer resting on a 3.0 micron pore 24-well transwell insert. Actin (Phalloidin) is shown in green and nuclei (DAPI) in blue. (D) TEER values of intestinal epithelial monolayers were measured at 7, 10, and 14 days of culture. Broken line indicates TEER value of 200 Ω.cm2, n = 6 donors. (E) FD4 permeability of intestinal epithelial monolayers cultured for 14 days and measured at 4 h post-FD4 addition in n = 4 donors. Permeability is expressed as FD4 permeation rate: FD4 basolateralt=4(μg)/FD4 apicalt=0(μg) (see supplementary material M2). Controls are transwell membranes without monolayers. ***P < 0.001, Unpaired t-test. (F) Viral infection of intestinal epithelial monolayers, determined by luciferase activity (Relative light units, RLU). Intestinal epithelial monolayers cultured to TEER >200 Ω.cm2 prior to exposure to SARS-CoV-2 pseudovirus for 5 days. Open circles represent individual donors, n = 6 donors. **P < 0.0052, unpaired t-test. (G) SARS-CoV-2 infection of intestinal epithelial monolayers, determined by confocal imaging. SARS-CoV-2 pseudovirus particles (Mouse IgG1 anti-p24) are shown in magenta, actin (Phalloidin) is shown in green and nuclei (DAPI) in blue 5 days post-inoculation. Scale bar = 15 micron, representative of n = 3. (H) Changes in morphology of intestinal epithelial monolayers upon infection for 24, 72, or 120 h with SARS-CoV-2 pseudovirus, determined by confocal microscopy. Actin (Phalloidin) is shown in green and nuclei (DAPI) in blue. Scale bar = 15 micron, representative of n = 2 donors.
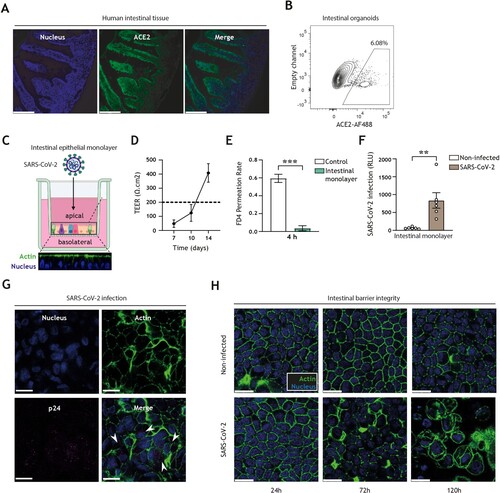
Figure 2. SARS-CoV-2 pseudovirus utilizes both the cell-surface entry route as well as the autophagy intracellular pathway to infect intestinal epithelial cells (A) Viral infection of Caco-2 cell line, determined by luciferase activity (RLU). Caco-2 cells were cultured to approximately 80% confluency, prior to infection with SARS-CoV-2 pseudovirus for 72 h. Open circles represent individual replicates, n = 8. **P < 0.05, unpaired. (B) Viral infection of Caco-2 cells pre-treated for 16 h with α-ACE2-antibody or isotype control, camostat mesylate, or left untreated, and subsequently exposed to SARS-CoV-2 pseudovirus for 72 h, determined by luciferase activity (RLU). Open circles represent individual replicates, n = 3–4, and data were normalized to the infected but untreated control. **P < 0.01, ***P < 0.001, One-sample t-test. α-ACE2-antibody versus isotype control *P < 0.044, Unpaired t-test. (C) Viral infection of Caco-2 cells upon transfection with control siRNA, or siSNAP29 followed by exposure to SARS-CoV-2 pseudovirus for 72 h, determined by luciferase activity (RLU). Open circles represent individual replicates, n = 4, and data were normalized to the infected siRNA treated control. *P < 0.05, One-sample t-test.
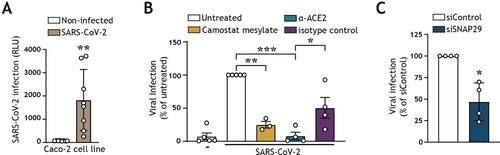
Figure 3. Pharmacological modulation of autophagy prevents SARS-CoV-2 pseudovirus acquisition by intestinal epithelial cells. (A) Graphical representation of the modes of action by which BBM and DAS modulate the autophagy pathway. (B, C) % Cell viability upon treatment of intestinal monolayers (B) or Caco-2 cell line (C) with BBM or DAS, determined by ATP-based CellTiter-Glo assay. (B) Intestinal epithelial monolayers were treated with optimized concentrations of BBM, or DAS, or left untreated, for 60 h. Open circles represent individual donors, n = 2 donors. (C) Caco-2 cells were treated with serial dilutions of BBM, or DAS, or left untreated, for 72 h. Open circles represent individual replicates, n = 2. (D) Graphical representation of the U87.LC3-mCherry-GFP autophagy reporter cell line employed to monitor autophagy flux. The GFP tag in the U87.LC3-mCherry-GFP cells are acid-sensitive and are quenched upon autophagosome acidification, permitting the monitoring of autophagy flux by measuring reduction in GFP signal. (E, F, G) Autophagy flux in U87.LC3-mCherry-GFP cells upon incubation with Bafilomycin A1 control, BBM, DAS, or left untreated, for 24 h. Autophagy flux was monitored by % GFP signal reduction, determined by flow cytometry (E, F) and imaging flow cytometry (G). Representative flow cytometry plots (E) and quantification of flow cytometry data (F), data are mean ± SE of n = 3 replicates represented by open circles; **P < 0.01, ***P < 0.001, Student's t-test. (G) Representative imaging flow cytometry overlays of bright field, mCherry, and GFP signal, four individual cells shown per condition are representative of n = 3 replicates; (H) Intracellular p62 accumulation in Caco-2 cell line upon treatment with BBM, DAS, or left untreated, for 72 h, measured by flow cytometer. Data are representative flow cytometry plots of n = 2 independent experiments performed in triplicate. (I, J) Viral infection of Caco-2 cell line (I) or intestinal monolayers (J) pre-treated with BBM, DAS, or left untreated, determined by luciferase activity (RLU). (I) Caco-2 cells were infected with SARS-CoV-2 pseudovirus for 72 h, data are mean ± SE of n = 6 replicates represented by open circles; *P = 0.0115, ****P < 0.0001, One sample t-test. (J) Intestinal epithelial monolayers were infected with SARS-CoV-2 pseudovirus for 5 days. Open circles represent individual replicates, n = 4 intestinal donors, ***P = 0.0005, ****P < 0.0001, one-sample t-test.
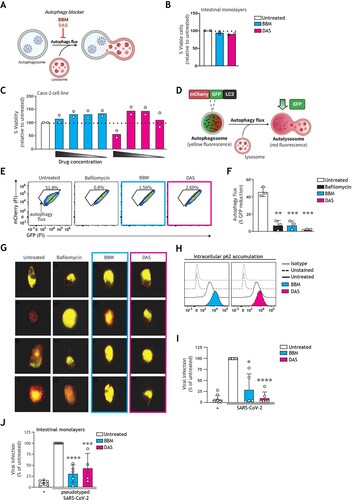
Figure 4. Berbamine limits SARS-CoV-2-mediated impairment of intestinal integrity. (A) Changes in morphology of intestinal epithelial monolayers upon pre-treatment with BBM, DAS, or left untreated for 24 h, followed by exposure to SARS-CoV-2 pseudovirus for 5 days, determined by confocal microscopy. Actin (Phalloidin) is shown in green and nuclei (DAPI) in blue. Scale bar = 15 micron, representative of n = 2. (B) Quantitative analysis of fluorescence intensity (FI) of actin staining of intestinal epithelial monolayers as shown in (A). Analyses of fluorescence intensity were performed at original magnification by measuring mean grey value with ImageJ software. Open circles represent averages derived from 5 different fields of view, n = 2 intestinal donors.
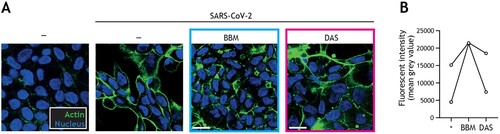
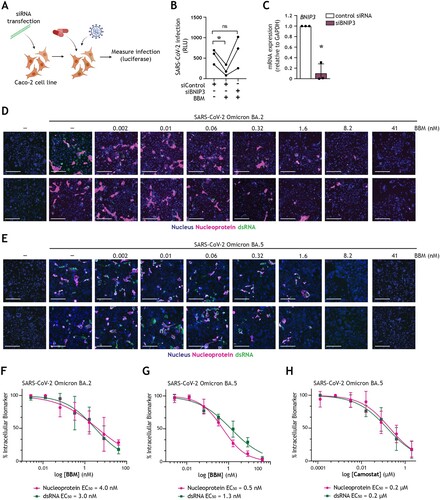
Figure 5. Berbamine abrogates intestinal SARS-CoV-2 replication in a BNIP3-dependent manner (A) Graphical representation of the experimental protocol utilized for viral infection of Caco-2 cells upon transfection with control siRNA or siBNIP3 followed by treatment with BBM as presented in (B, C). (B) Viral infection of Caco-2 cells upon transfection with control siRNA or siBNIP3 followed by treatment with BBM and subsequently exposed to SARS-CoV-2 pseudovirus for 72 h, determined by luciferase activity (RLU). Circles represent individual replicates, n = 3; *P < 0.05, Student’s t-test. (C) BNIP3 silencing efficiency was determined by real-time PCR. mRNA expression was normalized to GAPDH and set at 1 in cells treated with control-siRNA. *P < 0.05, one-sample t-test. (D-H) Viral infection of Caco-2 cells pre-treated with serially diluted BBM for 3 h followed by exposure to SARS-CoV-2 Omicron BA.2 (D, F) or SARS-CoV-2 Omicron BA.5 (E, G) for 48 h. (D, E) Representative fluorescent images of Caco-2 cells treated with the indicated concentrations of BBM. Control images of uninfected and untreated samples are also shown. Hoechst is shown in blue, nucleocapsid in red, and dsRNA in green. Scale bar = 100 micron. (F-H) Dose-response curves were generated for BBM (F, G) or camostat mesylate (H) in Caco-2 cells infected with SARS-CoV-2 Omicron BA.2 (F) or SARS-CoV-2 Omicron BA.5 (H, G), using nucleocapsid (magenta circle) and dsRNA (green square) as infection markers. EC50 values were determined using nonlinear regression analysis. Symbols indicate the mean values of n = 2 independent experiments.