Figures & data
Table 1. Demographic characteristics of patients in this study.
Figure 1. Mucosal sIgA and plasma IgG against SARS-CoV-2 prototype strain and Omicron sublineages. A–B. Mucosal S-sIgA responses against SARS-CoV-2 prototype strain and Omicron BA.1, BA.1.1, BA.2, BA.12.1, BA.2.75, and BA.4/5 induced by vaccine naïve-infected individuals (A) and inactivated vaccine-infected individuals (B). C–F. Plasma S-IgG titers against SARS-CoV-2 prototype strain and Omicron BA.1, BA.1.1, BA.2, BA.12.1, BA.2.75, and BA.4/5 induced by vaccine naïve-infected individuals (C), inactivated vaccine-infected individuals (D), inactivated vaccine-healthy individuals (E), and vaccine naïve-healthy individuals (F). Data in (C–F) are shown as the median with interquartile range (IRQ). The paired comparisons of sIgA and IgG titers were performed using two-tailed Wilcoxon matched-pairs signed-rank test.
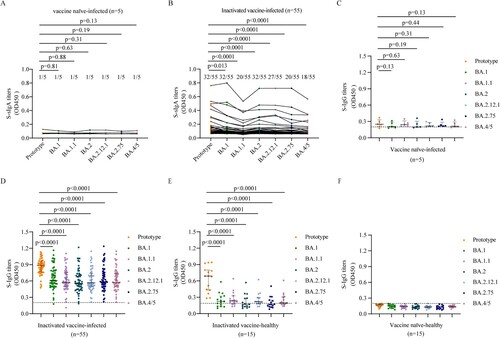
Figure 2. ADCC and ADCP activities against SARS-CoV-2 prototype strain and Omicron sublineages. ADCC (A–D) and ADCP (E–H) activities against SARS-CoV-2 prototype strain and Omicron BA.1, BA.1.1, BA.2, BA.12.1, BA.2.75, and BA.4/5 in vaccine naïve-infected individuals (A, E), inactivated vaccine-infected individuals (B, F), inactivated vaccine-healthy individuals (C, G), and vaccine naïve-healthy individuals (D, H). Data are shown as the median with IRQ. The paired comparisons of ADCP and ADCC activities were performed using two-tailed Wilcoxon matched-pairs signed-rank test.
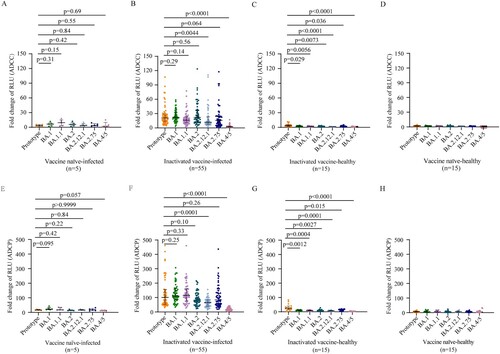
Figure 3. Neutralization against SARS-CoV-2 prototype strain and Omicron sublineages. A–B. Paired live virus neutralization titers against the prototype, BA.1, and BA.5 strain in vaccine naïve-infected individuals and inactivated vaccine-infected individuals (A), inactivated vaccine-healthy individuals and vaccine naïve-healthy individuals (B). C. Pairwise PVMN activities (50% half-maximal inhibitory does; ID50) against the prototype strain, and Omicron sublineages BA.1, BA.1.1, BA.2, BA. 2.12.1, BA.2.75, BA.4/5, BF.7, BQ.1, and XBB in vaccine naïve individuals with Omicron BA.1 infection and in individuals vaccinated with inactivated vaccine with BA.1 breakthrough infection. D. PVMN activities against the prototype strain and Omicron sublineages BA.1, BA.1.1, BA.2, BA.2.12.1, BA.2.75, BA.4/5, BF.7, BQ.1, and XBB among individuals with 2-dose inactivated vaccine primer, 3-dose inactivated vaccine booster, with BA.1 breakthrough infection. E. PVMN activities against the prototype strain and Omicron sublineages BA.1, BA.1.1, BA.2, BA.2.12.1, BA.2.75, BA.4/5, BF.7, BQ.1, and XBB in inactivated vaccine-healthy individuals and vaccine naïve-healthy individuals. F. Correlation matrix of PVMN activities against the prototype strain, and Omicron sublineages BA.1, BA.1.1, BA.2, BA.2.12.1, BA.2.75, BA.4/5, BF.7, BQ.1, and XBB. The dotted line in (A–C, E) denotes the cutoff value for positive neutralizing antibody titer. Solid lines in (A–E) denote the geometric mean titres (GMT) with 95% confidence interval (CI). Multiple comparisons of neutralizing antibody titers were performed using the Kruskal-Wallis test. The paired comparisons of neutralizing antibody titers were performed using two-tailed Wilcoxon matched-pairs signed-rank test. Single comparisons between 2-dose inactivated vaccine primer and 3-dose inactivated vaccine booster were performed using the Mann-Whitney U test. For the correlation analyses, correlograms plotting the Spearman rank correlation coefficient (r) between all paired parameters were created with the scipy package (v1.7.3) running in Spyder (5.3.3). *p < 0.05, **p < 0.01, ***p < 0.001, ****p < 0.0001. PVMN = pseudovirus neutralization.
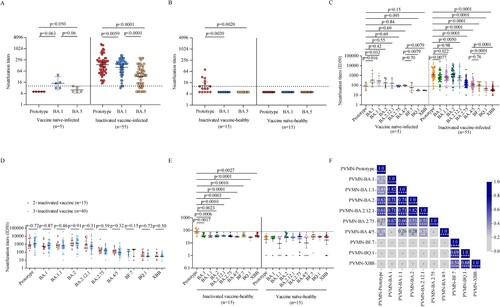
Figure 4. SARS-CoV-2 RBD-specific B cell responses induced by BA.1 breakthrough infection. A, D. Frequencies of memory B cells binding the prototype strain, the BA.1 strain, and the BA.4/5 strain in inactivated vaccine-infected individuals (A, n = 42) and inactivated vaccine-healthy individuals (D, n = 15). B, E. Frequencies of memory B cells binding the prototype strain only, both prototype and BA.1 stains (prototype + BA.1), and the BA.1 strain only in inactivated vaccine-infected individuals (B, n = 42) and inactivated vaccine-healthy individuals (E, n = 15). C, F. Frequencies of memory B cells binding the prototype strain only, both prototype and BA.4/5 strains (prototype + BA.4/5), and the BA.4/5 strain only in inactivated vaccine-infected individuals (C, n = 42) and inactivated vaccine-healthy individuals (F, n = 15). G. Correlation matrix of plasma IgG and memory B cells. Solid lines in (A–F) denote the median with IRQ. Multiple comparisons of memory B cell responses were performed using the Kruskal-Wallis test. For the correlation analyses, correlograms plotting the Spearman rank correlation coefficient (r) between all paired parameters were created with the scipy package (v1.7.3) running in Spyder (5.3.3). *p < 0.05, **p < 0.01, ***p < 0.001, ****p < 0.0001.
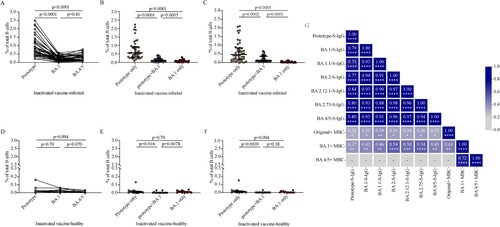
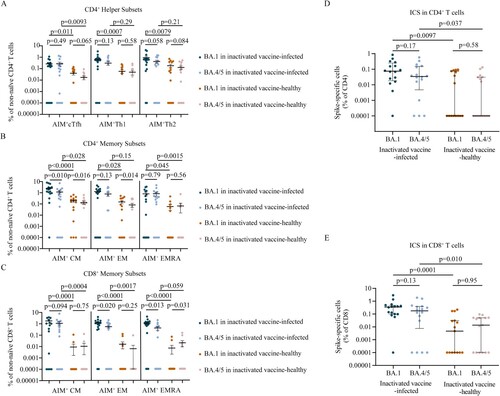
Figure 5. Memory T cell responses to Omicron sublineages in inactivated vaccine-infected individuals and inactivated vaccine-healthy individuals. A. Frequencies of AIM + CD4+ T helper subsets between BA.1 and BA.4/5 strains in inactivated vaccine-infected (n = 16) and inactivated vaccine-healthy (n = 15) individuals. B. Frequencies of AIM + CD4+ memory T subsets between BA.1 and BA.4/5 strains in inactivated vaccine-infected (n = 16) and inactivated vaccine-healthy (n = 15) individuals. C. Frequencies of AIM + CD8+ memory T subsets between BA.1 and BA.4/5 strains in inactivated vaccine-infected (n = 16) and inactivated vaccine-healthy (n = 15) individuals. D. The polyfunctional CD4+ T cell responses between BA.1 and BA.4/5 strains evaluated using the ICS assay in inactivated vaccine-infected (n = 16) and inactivated vaccine-healthy (n = 15) individuals. E. The polyfunctional CD8+ T cell responses between Omicron BA.1 and BA.4/5 strains evaluated using the ICS assay in inactivated vaccine-infected (n = 16) and inactivated vaccine-healthy (n = 15) individuals. Solid lines denote the median with IRQ. The paired comparisons of were performed using two-tailed Wilcoxon matched-pairs signed-rank test. Single comparisons between inactivated vaccine-infected and inactivated vaccine-healthy individuals were performed using the Mann-Whitney U test. cTfH = circulating T follicular helper cell; CM = central memory T cell; EM = effector memory T cell; EMRA = terminally differentiated effector memory T cell.