Figures & data
Figure 1. Construction and immunogenicity evaluation of COVID-19 vaccine candidates. (A) Schematic diagram showing the structure of pVAX1-based vaccine candidates encoding heterodimeric fusion RBDs of SARS, Beta and Omicron BA1 with a secretion leader sequence. Gene fragments were cloned into the BamH1 and XhoI sites of pVAX1 vector under human CMV promoter control. HEK293T cells, transiently transfected with pVAX1, pAD1002, pAD1003, or pADV131 24h earlier, were lysed, and the lysate subjected to (B) qPCR detection of RBD mRNA transcripts using GPDH as internal control, and (C) SDS-PAGE gel electrophoresis followed by Western blotting using anti-RBDWT Abs for detection. Culture supernatant of the transfectant HEK293T cells was harvested for quantitation of secreted recombinant RBD chimera using RBDWT-based ELISAs (D–F). (G) Serum samples, collected from BALB/c mice after primary (1 dose) and secondary (2 doses) IM immunizations with plasmid pAD1002, pAD1003 or pADV131 (20 μg/dose) were titrated against recombinant RBDWT in ELISAs. (H) Sera from BALB/c mice 14 days after primary (1 dose) and secondary (2 doses) IM, or IM + EP, inoculation of plasmid pWT were analysed in RBDWT-based ELISA. Data represent mean ± SD (n = 3 biologically independent samples).
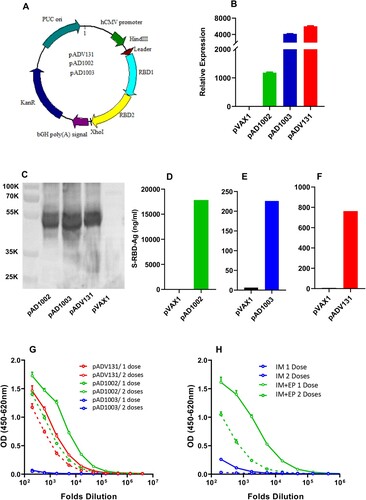
Figure 2. Fabrication of MAPAdv for intradermal DNA delivery. (A) Schematic diagram showing the fabrication procedure for MAPAdv. (B) Photograph of a MAPAdv skin patch, which is of 1.2 cm in diameter, with an array of 486 MNs loaded with 20 μg plasmid DNA. (C, D) Microphotographs show the structure of arrayed MNs in MAPAdv. The MNs in MAPAdv patch are 450 μm in height, including a 350 μm cone-shaped needle and tapered base of 100 μm (D). For stability analysis, samples of MAP-1002 patches, maintained at 4°C or 25°C for 1–4 weeks, were emersed in 2 ml saline for 1 h to allow complete dissolution of MNs. The solution was subjected to HPLC profiling (E) and quantitation of DNA (F), expressed as percent plasmid DNA in supercoil form (left axis) and percent DNA recovery (right axis).
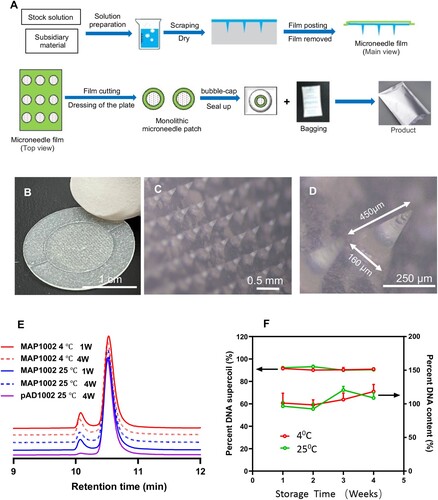
Figure 3. In vivo visualization of gene expression in mouse skin after MAPAdv-mediated pVAX1-Luc delivery. (A) Bioluminescent images (automated exposure) of living BALB/c mice administered with 4 MAP-Luc, or MAP-pVAX1, patches on dorsal sides 24 h previously. (B) Freshly prepared dorsal skin, skinned body, dLNs and spleen from a BALB/c mouse treated with 4 MAP-Luc patches 48 h earlier were subjected to bioluminescent imaging. (C, D) C57BL/6 and BALB/c mice (n = 3) were administered with MAP-Luc patches (1 patch each mouse, on dorsal side, for 15 min), followed by bioluminescent imaging at different timepoints up to 480 hrs post administration. Images from one representative mouse of each group are shown in C. (D) Bioluminescence intensity at sites of MAP-Luc application for each C57BL/6 or BALB/c mouse throughout the 480 hrs observation period was quantitated and recorded. Each line represents one individual mouse. The above is representative of 3 independent experiments.
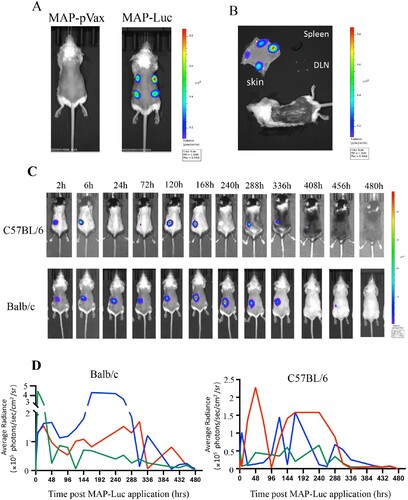
Figure 4. Immunogenicity-boosting effect of MAPAdv in DNA immunization. Groups of BALB/c mice were given two doses (20 μg DNA/dose, with fortnight intervals) of plasmid pADV1002 (A), pAD1003 (B), or pADV131 (C) via MAP, IM or IM + EP delivery. Serum samples, collected 14 days after boost, were titrated against recombinant RBDWT in ELISAs. Serum IgG titers in BALB/c mice after MAP- or IM + EP-mediated immunization with plasmid pAD1002 (D), pAD1003 (E), or pADV131 (F) were monitored using RBDWT-based ELISAs for up to 70, 126, or 182 days, respectively, after primary immunization. (G) Serum samples, collected from BALB/c mice (n = 5) on days 14, 28, 35 and 42 after primary (Day 0) immunization with decreasing DNA doses (20, 10, 5 μg/dose) delivered by a full-, half- or quarter-sized MAP-131, respectively, were titrated against recombinant RBDWT in ELISAs. Boost immunization was given with the same dosage MAP-131 on Day 14. Dose-response curves were obtained by plotting endpoint dilution serum IgG titers against MAP-delivered DNA doses. (H) Serum IgG titers in C57BL/6 mice (n = 5) and (I) New Zeeland white rabbits (n = 3) administered with two doses of MAP-1002 (1 patch/dose/mouse, 10 patches/dose/rabbit), or pAD1002/IM + EP (20 μg/dose/mouse, 200 μg/dose/rabbit), or pVAX1/IM + EP as control. Data represent mean ± SEM.
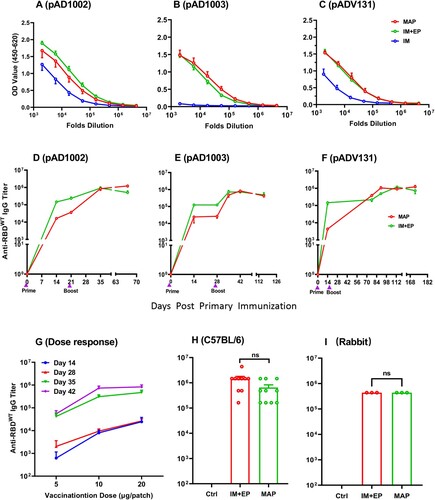
Figure 5. SARS-CoV-2-specific T cell responses induced by MAP-1002 in mice. BALB/c mice were immunized twice with, or without (NC), MAP-1002 or inactivated virus vaccine (Inactivated) and then sacrificed for spleens and dLNs 14 days after boost. ELISpot analyses of (A) IFN-γ and (B) IL-4 spot-forming cells (SFC) in splenocytes and dLN cells were performed after re-stimulation with pooled 14-mer overlapping peptides spanning the RBDWT sequence. (C–E) CD8+ T cells amongst dLN cells of BALB/c mice 14, 21 and 35 days post MAP-1002 immunization were assayed for IFN-γ (C), IL-2 (D) and TNF-α (E) expression by intracellular cytokine staining (ICS) and FACS analysis after re-stimulation with the RBDWT peptide pool. LN cells from the unimmunized (Blank) mice were included as control. (F) Gating strategy for CD8 + CD62L-CXCR1+ TEMs in mouse LN cells. (G) Percentages of CD8+ TEM amongst LN cells of BALB/c mice 14, 21 and 35 days after MAP-1002 administration (red line), as revealed by flow cytometric analysis results, are compared with that of unimmunized mice (black line). (H) Draining LN cells from C57BL/6 mice 14 days after MAP-1002, or MAP-pVAX1, immunization were stained with PE-labeled “S Tetramer” for identification of CD8+ T cells expressing TCR specific for S peptide/H-2Db complex by flow cytometry. (I) Histograms compare the percentages (left panel), or absolute numbers (right panel), of the S tetramer+ cells amongst CD8+ T lymphocytes of C57BL/6 mice immunized with either MAP-pVAX1 or MAP-1002. Data are means ± SEM. P values were analysed with two-tailed Mann-Whitney test (*p < 0.05; **p < 0.01).
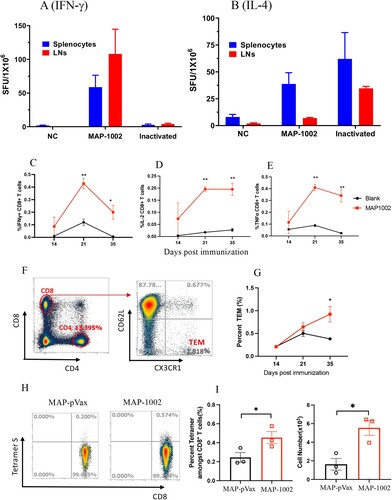
Table 1. Comparison of RBD cross-binding titers of serum IgG in BALB/c mice following immunization with MAP-based DNA vaccines or pWT/IM + EPTable Footnotea.
Figure 6. Broad spectrum neutralization of mouse antibodies induced by MAP- DNA vaccination. (A, B) BALB/c mouse serum samples collected 14 days post boost immunization with MAP-1002, MAP-1003 or MAP-131 were tested for ability to block mimic infection of hACE2-expressing HEK293T cells by pseudoviruses displaying the S protein of WT SARS-CoV-2 or Omicron BA.1 subvariant. The results are expressed as percent inhibition of infection. (C) Antisera from BALB/c mice immunized with either MAP-1002 or pWT/IM + EP were tested for neutralization of pseudoviruses representing WT SARS-CoV-2, Beta, Delta, Omicron BA.1, BA.2 or BA.4/5. The results are expressed as NT50 titers. (D) Antisera from BALB/c mice immunized with MAP-1002, pAD1002/IM, pAD1002/IM + EP or pWT/IM + EP were compared for ability to block mimic infection of hACE2-expressing HEK293T cells by SARS-CoV-1 pseudovirus. The results are expressed as percent inhibition of infection. Data are means ± SEM.
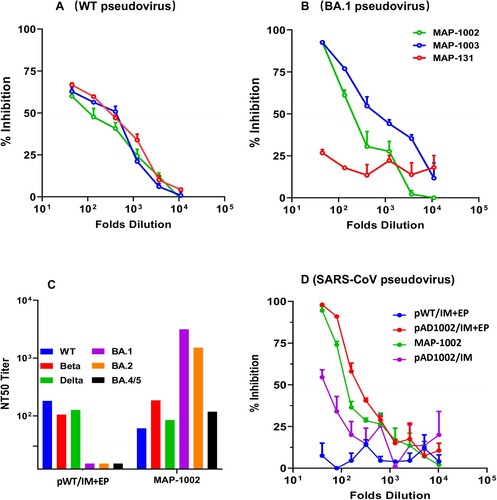
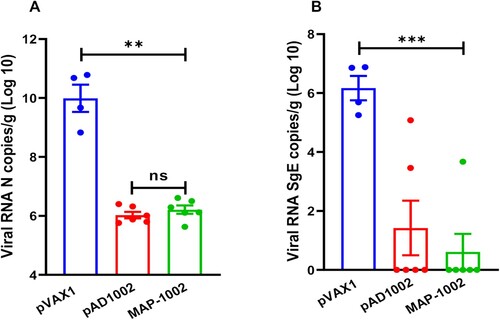
Figure 7. Protection efficacy of MAP-1002. Groups of hACE2-transgenic mice (n = 6) were immunized with 2 doses (14 days apart) of MAP-1002, or pAD1002/IM + EP, or pVAX1/IM + EP as sham control. Twenty-one days after boost, the mice were intranasally challenged with 5 × 10³ TCID50 of SARS-CoV-2 Omicron BA.1 variant. At 4 dpi, all mice were euthanized and necropsied, and lung samples were collected for virus titration using qPCR for detection of N (A) and sgE (B) gene sequences of the SARS-CoV-2 BA.1 virus. The results are expressed as viral copy numbers per gram tissue. Data are means ± SEM.