
Figures & data
Figure 1. Forest plot for the risk factors associated with MPP when compared with the control group. The odds ratio (OR) was based on the logistic regression model and adjusted for a potential confounding factor (age). MPP, Mycoplasma pneumoniae pneumonia patient; Control, other bacterial or viral pneumonia; CI, confidence interval.
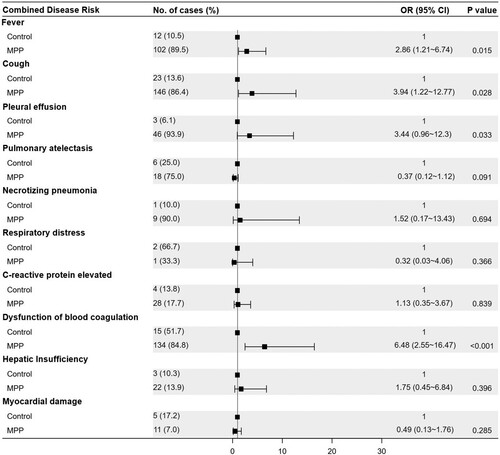
Table 1. Characteristics of the study population.
Figure 2. Comparisons of respiratory microbiota in MPP and Control groups. (A) Alpha diversity was evaluated by the Shannon index. (B) Alpha diversity was evaluated by the Simpson index. (C) Principal coordinate analysis based on the Weighted Unifrac matrix between MPP and Control groups. (D) Relative abundance of respiratory microbiota at the phylum and genus level. (E) The species with significant differences in abundance between the two groups by using LEfSe analysis. MPP, Mycoplasma pneumoniae pneumonia patient; Control, other bacterial or viral pneumonia. **P < 0.01, ***P < 0.001.
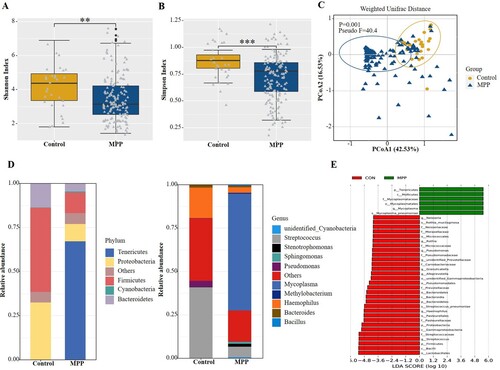
Figure 3. Comparisons of respiratory microbiota in Control, severe MPP, and mild MPP groups. (A) Alpha diversity was evaluated by the Shannon index. (B) Alpha diversity was evaluated by the Simpson index. (C) Principal coordinate analysis based on the Weighted Unifrac matrix. (D) Relative abundance of respiratory microbiota at the phylum and genus level. (E) The species with significant differences in abundance between the mild and severe MPP groups by using LEfSe analysis. MPP, Mycoplasma pneumoniae pneumonia patient; Control, other bacterial or viral pneumonia. ***P < 0.001.
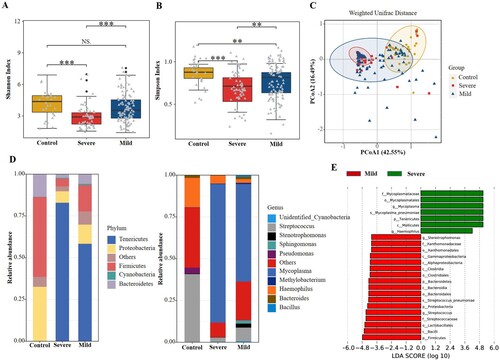
Figure 4. Comparisons of respiratory microbiota in MPP children enrolled based on different diagnostic standard. (A) Alpha diversity was evaluated by the Shannon index. (B) Principal coordinate analysis based on the Weighted Unifrac matrix. (C) Relative abundance of respiratory microbiota at the phylum level. (D) Relative abundance of respiratory microbiota at the genus level. NS, no significance.
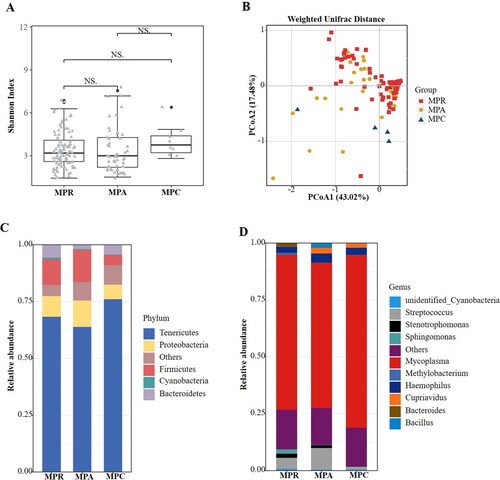
Figure 5. Relative abundance of Tenericutes, Mycoplasmataceae and Mycoplasma in MPP and Control groups. (A) Tenericutes. (B) Mycoplasmataceae. (C) Mycoplasma. MPP, Mycoplasma pneumoniae pneumonia patient; Control, other bacterial or viral pneumonia. ***P < 0.001.
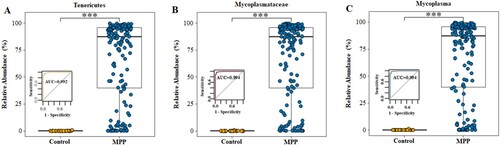
Figure 6. Relative abundance at the genus level of the children with discordant diagnosis based on the clinical diagnosis and Mycoplasma abundance.
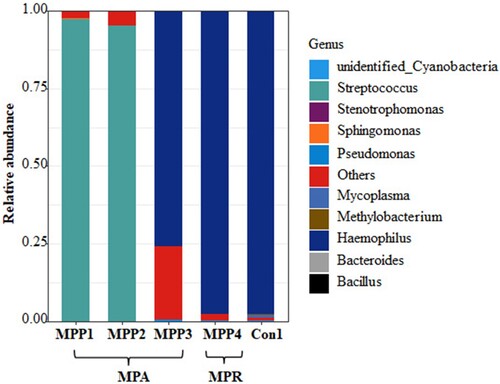
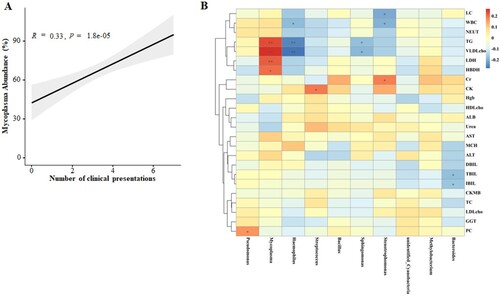
Figure 7. Correlation networks between microbiota and disease severity. (A) Concordance of the MP abundance and complication numbers. (B) Correlation between the different abundance of respiratory microbiota at the genus level and the clinical indices in children with severe MPP when compared with mild MPP.