Figures & data
Figure 1. Study flow chart. (A) Main study flow chart; (B) A schematic diagram of the visits for sampling during AE. 1–3 samples: the number of sputum samples collected from the same patient; ≥4 samples: 89 patients collected 4 or more sputum samples; Clinical stable: patients did not have an exacerbation at outpatient visit; AE: acute exacerbation; Day1: outpatient visit at AE onset; Days 4,7,14: days 4, 7, 14 after the onset of AE; URTI: Upper respiratory tract infection; URTI-AE: URTI-related AE as an AE occurring within 21 days of URTI; Non-URTI-AE: the AE without onset of URTI; EURTI-AE: AE occurring within 3 days following the onset of URTI; LURTI-AE: AE occurring 3 days after but less than 21 days following onset of URTI. URTI-non-AE: URTI without onset of AE; non-URTI-non-AE: mean stable, without URTI and without onset of AE.
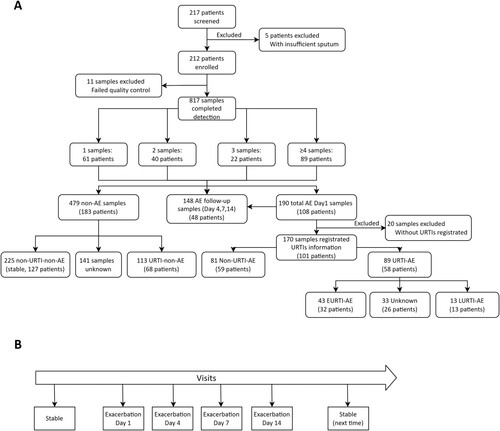
Table 1. Baseline characteristic of the study participants.
Figure 2. The pathogen detection status of URTI-AE and non-URTI-AE. (A) The pathogen distribution of bacteria and viruses between URTI-AE and non-URTI-AE; (B) The pathogen distribution of bacteria shifting and viruses between URTI-AE and non-URTI-AE. P < 0.001 for the ratio between URTI-AE (n = 89) and non-URTI-AE (n = 81) according to the chi-square test (A) or Fisher’s test (B). URTI-AE: exacerbation associated with URTI; non-URTI-AE: acute exacerbation not associated with URTI. B + V+: both bacteria and virus detected; B + V−: bacteria detected but no virus detected; B−V+: virus detected but no bacteria detected; B−V−: neither bacteria nor virus detected. S + V+: bacterial spectrum shifting with virus detected, S + V−: bacterial shifting but no virus detected; S−V+: no bacterial shifting with virus detected; S−V−: neither bacterial shifting nor virus detected.
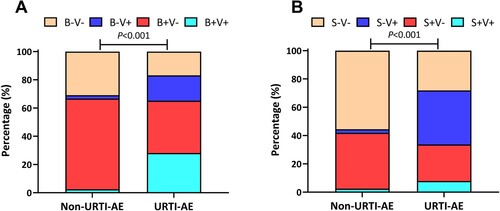
Figure 3. Pathogen detection status associated with URTI-AE. (A) The rate of viral detection in URTI-AE and non-URTI-AE; (B) The rate of bacterial detection in URTI-AE and non-URTI-AE; (C) The rate of bacterial shifting in URTI-AE and non-URTI-AE; (D) The rate of viral detection in EURTI-AE and LURTI-AE; (E) The rate of bacterial detection in EURTI-AE and LURTI-AE; (F) The rate of bacterial shifting in EURTI-AE and LURTI-AE. URTI-AE: n = 89; non-URTI-AE: n = 81; EURTI-AE: n = 43; LURTI-AE: n = 13. Chi-square test was applied for all comparisons. URTI-AE: AE associated with URTI; Non-URTI-AE: AE not associated with URTI; EURTI-AE: AE occurring within 3 days after the onset of URTI; LURTI-AE: AE occurring more than 3 days after the onset of URTI; Virus-: no virus detected; Virus+: any virus detected; Bacteria-: no bacteria detected; Bacteria+: any bacteria detected; Bacteria shifting: bacteria differed at exacerbation compared with the stable visit; Non-shifting: no bacterial shifting at exacerbation compared with the stable visit.
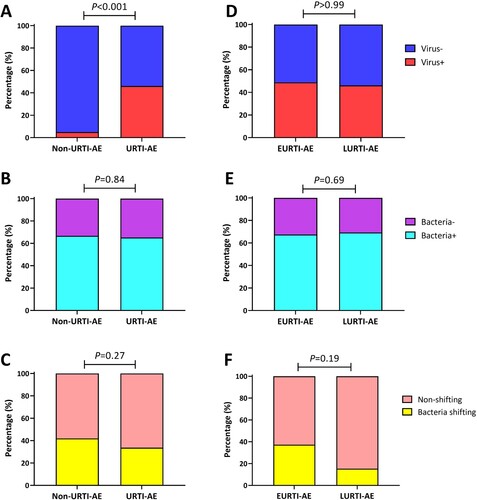
Figure 4. The pathogen spectrum of URTI-AE. Shown are the different rates or pathogen spectrum among non-URTI-AE and URTI-AE: (A) The detection rate of the top 5 viruses; (B) The threshold cycle (Ct) of rhinovirus; (C) The Ct of influenza virus; (D) The Ct of coronavirus; (E) The Ct of metapneumovirus; (F) The Ct of HSV. URTI-AE: n = 89; non-URTI-AE: n = 81; EURTI-AE: n = 43; LURTI-AE: n = 13. *: P < 0.05; **: P < 0.01; ns: P > 0.05. P value was calculated based on the chi-square or Fisher’s test for comparisons of the rate, or Mann–Whitney U test for comparisons of the Ct. RV: rhinovirus, included rhinovirus A and B; Inf: influenza virus, included influenza virus A, B and H1N1; CoV: coronavirus, included coronavirus OC43, 299E, HKU1 and NL63; HpMV: human metapneumovirus; HSV: herpes simplex virus; Others included parainfluenza virus 1-4, bocavirus, respiratory syncytial virus, enterovirus and adenovirus; URTI-AE: AE associated with URTI; Non-URTI-AE: AE not associated with URTI; EURTI-AE: AE occurring within 3 days after the onset of URTI; LURTI-AE: AE occurring more than 3 days after the onset of URTI.
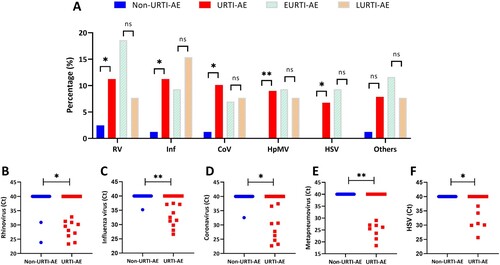
Figure 5. Temporal changes in the symptom burdens of URTI-AE and non-URTI-AE. We have conducted symptom questionnaire survey since July 2020. We have included the complete data at different visits for analysis only. (A) The temporal patterns in symptoms burden of URTI-AE and non-URTI-AE (absolute measured values) evaluated with the BEST score; (B) The temporal changes in symptoms burden of URTI-AE and non-URTI-AE, evaluated with the BEST score as compared with clinically stable visits. (C) Changes in the BEST scores at AE onset compared with the score at stable visit with or without URTI stratified by different bacteria and viruses detection status; and (D) Changes in the BEST scores at AE onset compared with the score at stable visit with or without URTI stratified by bacterial shifting and viruses detection status. For the BEST score, the sample size was 26 for URTI-AE and 34 for non-URTI-AE. Δ: Score of Day 1, 4, 7, 14 minus score of Stable state, respectively. Data from the last or the subsequent stable state following an AE were included in the analysis. The one-way analysis-of-variance model of repeated measures was applied in Panel A (coloured shade for the 95% confidence interval of the mean). #: P < 0.05 denoted statistically significant difference in the score between AE onset or the time points after the onset of AE compared with stable status in URTI-AE. &: P < 0.05 denoted statistically significant difference in the score between AE onset or the time points after the onset of AE compared with stable status in non-URTI-AE. The Mann–Whitney U test was applied between the two groups in (B–D) [(error bars for the medians (IQR)]. *: P < 0.05 between groups. The date of symptom recovery was ascertained if the symptom score was not significantly different from the baseline levels (Stable state). Stable: no onset of URTI or AE; AE: acute exacerbation; URTI-AE: AE associated with URTI; Non-URTI-AE: AE not associated with URTI; BEST: the Bronchiectasis Exacerbation and Symptom Tool; Day 1: outpatient visit at AE onset; Day 4, 7, 14: days 4, 7, 14 after the onset of AE. B + V+: both bacteria and virus detected; B + V−: bacteria detected but no virus detected; B−V+: virus detected but no bacteria detected; B−V−: neither bacteria nor virus detected. S + V+: bacterial spectrum shifting with virus detected, S + V−: bacterial shifting but no virus detected; S−V+: no bacterial shifting with virus detected; S−V−: neither bacterial shifting nor virus detected.
![Figure 5. Temporal changes in the symptom burdens of URTI-AE and non-URTI-AE. We have conducted symptom questionnaire survey since July 2020. We have included the complete data at different visits for analysis only. (A) The temporal patterns in symptoms burden of URTI-AE and non-URTI-AE (absolute measured values) evaluated with the BEST score; (B) The temporal changes in symptoms burden of URTI-AE and non-URTI-AE, evaluated with the BEST score as compared with clinically stable visits. (C) Changes in the BEST scores at AE onset compared with the score at stable visit with or without URTI stratified by different bacteria and viruses detection status; and (D) Changes in the BEST scores at AE onset compared with the score at stable visit with or without URTI stratified by bacterial shifting and viruses detection status. For the BEST score, the sample size was 26 for URTI-AE and 34 for non-URTI-AE. Δ: Score of Day 1, 4, 7, 14 minus score of Stable state, respectively. Data from the last or the subsequent stable state following an AE were included in the analysis. The one-way analysis-of-variance model of repeated measures was applied in Panel A (coloured shade for the 95% confidence interval of the mean). #: P < 0.05 denoted statistically significant difference in the score between AE onset or the time points after the onset of AE compared with stable status in URTI-AE. &: P < 0.05 denoted statistically significant difference in the score between AE onset or the time points after the onset of AE compared with stable status in non-URTI-AE. The Mann–Whitney U test was applied between the two groups in (B–D) [(error bars for the medians (IQR)]. *: P < 0.05 between groups. The date of symptom recovery was ascertained if the symptom score was not significantly different from the baseline levels (Stable state). Stable: no onset of URTI or AE; AE: acute exacerbation; URTI-AE: AE associated with URTI; Non-URTI-AE: AE not associated with URTI; BEST: the Bronchiectasis Exacerbation and Symptom Tool; Day 1: outpatient visit at AE onset; Day 4, 7, 14: days 4, 7, 14 after the onset of AE. B + V+: both bacteria and virus detected; B + V−: bacteria detected but no virus detected; B−V+: virus detected but no bacteria detected; B−V−: neither bacteria nor virus detected. S + V+: bacterial spectrum shifting with virus detected, S + V−: bacterial shifting but no virus detected; S−V+: no bacterial shifting with virus detected; S−V−: neither bacterial shifting nor virus detected.](/cms/asset/9b5514ae-ec7d-4d8d-8c8c-78ffc588fd02/temi_a_2202277_f0005_oc.jpg)
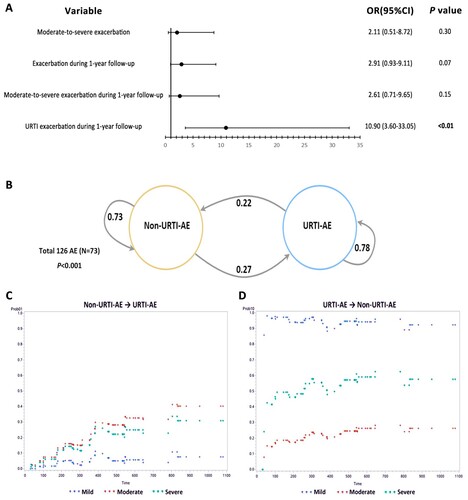
Figure 6. URTI-AE associated with bronchiectasis and the corresponding transfer probability. (A) The generalized estimating equation models were adjusted for age, sex and BSI score. Three AEs without information pertaining to the severity were excluded from analysis. Ultimately, 110 AE samples had the corresponding AE occurrence and severity within a following 1-year period, where 86 AE samples had registered URTI occurrence and other 24 samples were excluded from analysis due to missing of the core data. URTI: Upper respiratory tract infection; AE: acute exacerbation. Data in bold indicated the analyses with statistical significance. (B) The transfer probability of non-URTI-AE and URTI-AE in the next AE during longitudinal follow-up. After excluding the samples without onset of AE within the 1-year follow-up, 73 samples were included in the Markov chain model for the transition probability analysis. (C) The probability of non-URTI-AE transferring to URTI-AE categorized by the BSI; (D) The probability of URTI-AE transferring to non-URTI-AE when categorized by the BSI. We calculated the frequency of each state transition as the probability required by the Markov chain model. Chi-square test was used to test the transition probability. Andersen Gill model was implemented by using the proc phreg package with the SAS program. BSI: Bronchiectasis Severity Index; URTI-AE: AE associated with URTI; Non-URTI-AE: AE not associated with URTI.