Figures & data
Figure 1. Generation of the consensus sequence H1c. (A) A total of 4,367 sequences were obtained from the NCBI influenza database (January 2011 to June 2020) and classified into ten groups according to the year of isolation. Online alignment was performed for each group, and ten primary consensus sequences were generated. VectorNTI software was used for the second round of comparison, and a final consensus sequence was obtained after optimization. (B) A phylogenetic tree was constructed for the consensus sequence H1c and HA protein sequences of H1N1 influenza vaccines recommended by the WHO from 2011 to 2020 on the basis of the neighbor-joining method using MEGA5.0 software.
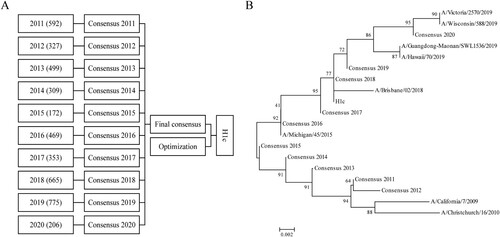
Figure 2. Design and identification of mRNA encoding H1c. (A) Sketch map showing the mRNA expressing H1c. (B) Integrity of the H1c-mRNA determined using Agilent 5200 Fragment Analyzer. (C) H1c expression in HEK293 T cells detected through WB assay. H1c-mRNA was transfected into HEK293 T cells using Lipofectamine™ MessengerMAX™ Reagent. The cells were harvested at 24 h after incubation, after which they were lysed and detected through the WB assay. (D) H1c expression confirmed by immunofluorescence staining. HEK293 T cells transfected with H1c-mRNA were fixed with 4% paraformaldehyde after incubation for 24 h, after which they were evaluated by immunofluorescence analysis. (E) Size distribution of H1c-mRNA-LNPs measured using Nano-ZS90 through the dynamic light scattering method. WB, western blotting.
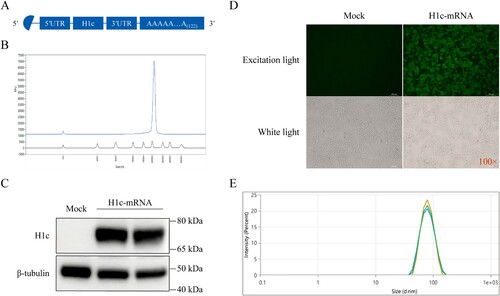
Figure 3. Cross-reactive antibody response of H1c-mRNA-LNPs in mice. (A) Flow chart of the immunization, sampling, and challenge protocol. Each BALB/c female mouse received intramuscular immunization with 2 µg (n = 9), 10 µg (n = 9), or 20 µg (n = 9) of H1c-mRNA-LNPs, followed by a booster at the same dose on day 21. Mice received 15 µg of the H1N1 split vaccine (n = 9) or PBS (n = 9) as control. Serum was harvested on days 21 and 42 after the initial immunization. (B) Antigen-specific antibodies were determined by hemagglutination-inhibition test. (C) Antigen-specific IgG, IgG1, and IgG2a were evaluated through indirect ELISA (n = 4). Two-way and one-way ANOVA were adopted to compare differences for (B) and (C), respectively. *, P < 0.05; **, P < 0.01; ***, P < 0.001; ****, P < 0.0001; ns, not significant. HAI, hemagglutination-inhibition; ANOVA, analysis of variance; IgG, immunoglobulin G; PBS, phosphate-buffered saline.
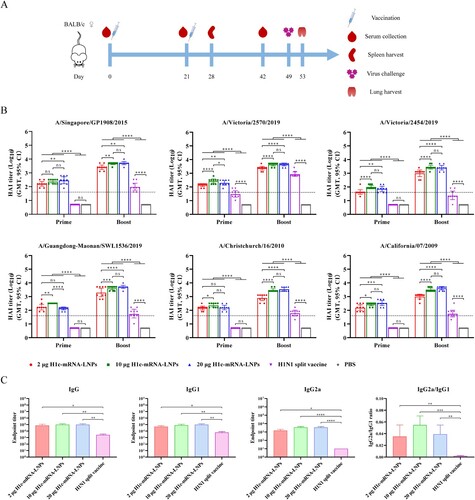
Figure 4. Profiles of pro-inflammatory cytokines. Serum was harvested from mice immunized with H1c-mRNA-LNPs (10 µg), and pro-inflammatory cytokines were measured at 0, 3, 6, 12, 24, 48, 72, and 96 h after the initial immunization. Serum pro-inflammatory factors, including IL-1β, IL-12, IL-23, IL-27, MCP-1, IL-6, TNF-α, IFN-β, and IFN-γ were determined as a panel of mouse inflammatory factors by flow cytometry (n = 5). Differences were compared using two-way ANOVA. *, P < 0.05; **, P < 0.01; ***, P < 0.001; ****, P < 0.0001; ns, not significant. ANOVA, analysis of variance; IFN, interferon; IL, interleukin; MCP, monocyte chemoattractant protein; TNF, tumour necrosis factor.
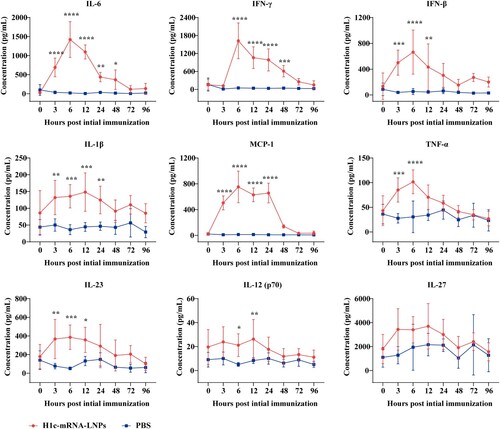
Figure 5. T-cell responses resulting from H1c-mRNA-LNPs in mice. Mice were initially immunized with H1c-mRNA-LNPs (10 µg) as a two-dose regimen. Splenocytes were harvested on day 28 following initial immunization. CD4+ T cells and CD8+ T cells that secreted TNF-α, IFN-γ, and IL-2 were analyzed through flow cytometry (n = 4). The results are presented as mean ± SD. Differences were compared using an unpaired t-test. *, P < 0.05; **, P < 0.01; ***, P < 0.001; ****, P < 0.0001; ns, not significant. CD, cluster of differentiation; IFN, interferon; IL, interleukin; SD, standard deviation; TNF, tumour necrosis factor.
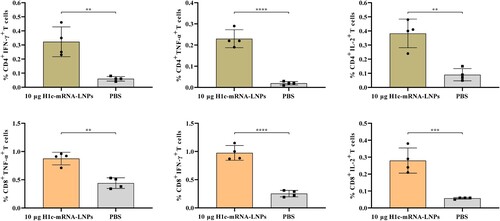
Figure 6. Protective efficacy of the H1c-mRNA-LNP vaccine in mice following challenge with various H1N1 influenza viruses. Mice were immunized with H1c-mRNA-LNPs (10 µg) in two doses in a 3-week interval. Forty-nine days after initial immunization, each mouse received intranasal inoculation (100 µL) of each of the following viruses: A/Singapore/GP1908/2015 (107.33 CCID50/0.1 mL), A/Guangdong-Maonan/SWL1536/2019 (107.23 CCID50/0.1 mL), A/Victoria/2570/2019 (105.48 CCID50/0.1 mL), or A/California/07/2009 (107.00 CCID50/0.1 mL). (A) Body weight of the animals measured daily for 14 days (n = 8 each group). Data are presented as proportion of original weight. (B) Survival rates monitored daily for 14 days (n = 8 each group). (C) Viral loads in the lung tissues measured through plaque assay 4 days after the challenge (n = 4 each group). The results are presented as mean ± SD. PFU, plaque forming unit; SD, standard deviation.
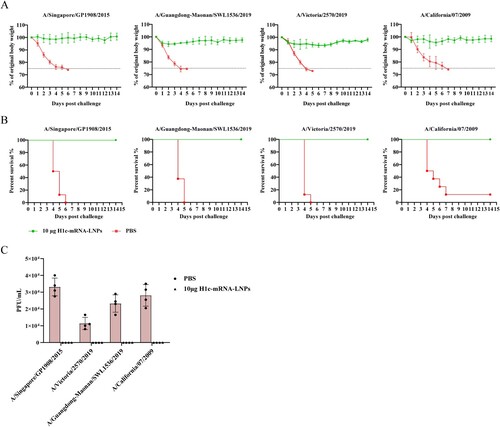
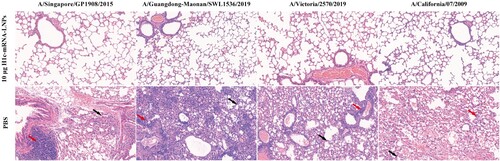
Figure 7. Lung pathology of the challenged mice. Paraformaldehyde (4%) was added to fix the lung tissues collected from challenged mice. The tissues were then paraffin-embedded, sectioned, and stained with hematoxylin-eosin. A digital slide scanner (3DHISTECH, Hungary) was used for image scanning. The black arrow indicates alveolar septal thickening, while the red arrow indicates inflammatory cell infiltration.