
Figures & data
Figure 1. 14-day accumulated incidence (AI) and variants observed in the Canary Islands from December 2020 to July 2022. Note that, from the end of March 2022 (red dotted vertical line), only samples from >60 years old or hospitalized patients were sequenced and included in the 14-days AI calculation by public health authorities. Black line, 14-days AI.
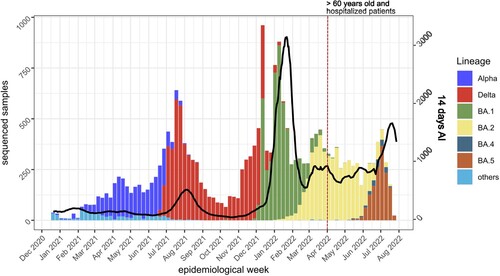
Figure 2. Proportion of reinfections observed in the Canary Islands by lineage. The proportion of reinfections was calculated as the number of reinfections by lineage divided by the total number of infections by that lineage. Pairwise proportions tests with post hoc Holm correction were applied. Only p values between BA.5 and the other lineages are shown. Error bars represent the standard error of sample proportion.
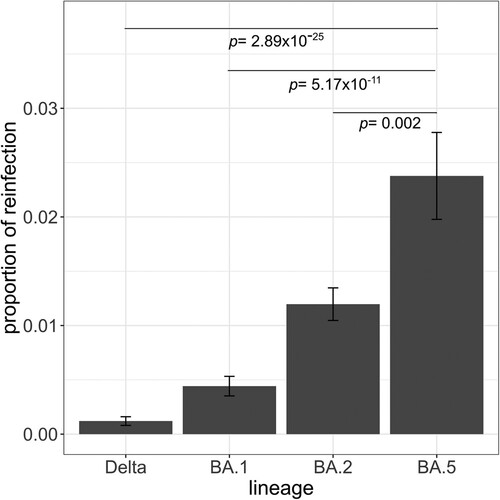
Figure 3. Proportion of primary infections in lineage-causing reinfections. Each panel encompasses the lineage causing the secondary infection and each bar represents the number of reinfection cases by lineage causing the primary infection normalized by the total number of cases assigned to that lineage throughout the study period. Fisher’s exact tests with post hoc Holm correction were applied to test the significance of the intra-group differences. Only significantly different comparisons are shown. Error bars represent the standard error of sample proportion. Reinfection cases with primary infection with n = 1 were excluded.
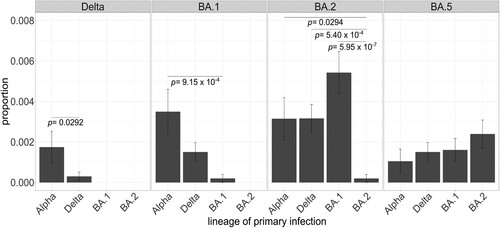
Figure 4. Maximum likelihood phylogenetic tree of SARS-CoV-2 sequences (radial) placing the sequences from 1,144 hospitalized cases with infections in the Canary Islands throughout the study period. The tree also includes relationships with other 1,504 genome sequences representative of major clades (light grey), labelled based on Nextstrain definitions, from Nextclade v2.13.0 and Auspice v2.24.2 (as of 2023-03-24), and sampled between December 2019 and July 2022 for reference.
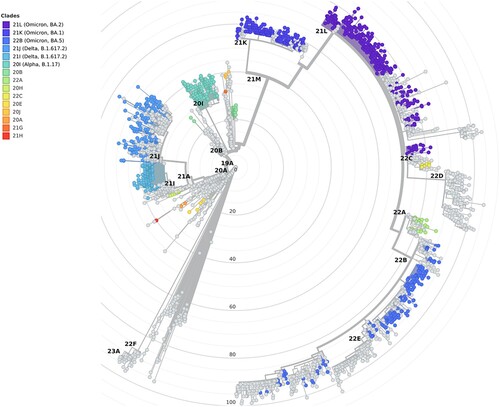
Table 1. Demographic and clinical data of hospitalized cases with Alpha, Delta, BA.1, BA.2, and BA.5 infections in the study period.
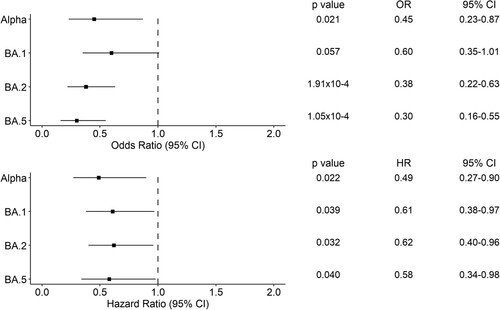
Figure 5. Forest plots of the 28-day hospital mortality associated with the presence of a variant of concern compared to Delta. The upper panel shows the estimated odds ratio (OR) and the 95% confidence interval (CI) from the logistic regression analysis. The lower panel shows the hazard ratio (HR) and the 95% CI from the Cox regression analysis. P-values are also reported.
Supplemental Material
Download MS Word (174.9 KB)Data availability statement
Sequences in FASTA format and associated metadata have been deposited in GISAID (https://gisaid.org) under identifiers EPI_SET_230213uw and EPI_SET_230322qh.