
Figures & data
Figure 1. Detection of respiratory viral load and clinical characteristics during infection. (A) Flow chart of experimental protocol. (B) Viral load in throat swabs of WT mice infected with different strains and lung viral load on day 5 after infected with different strains in WT mice. (C) Viral gRNA and sgRNA in throat swabs of db/db and WT mice after infection. (D) Lung viral gRNA and sgRNA of db/db and WT mice on 7 dpi. (E) Abdominal temperature change after infection. (F) Body weight change percentage after infection. (G) Fasting blood glucose after infection. (H) Food intake for seven days. (C) (E-G) were analysed by one-way ANOVA with Tukey’s posttest, red * present the differences between infected and uninfected db/db mice and black * present the differences between infected and uninfected WT mice. (D) (H) were analysed by unpaired t-test. *p < 0.05, **p < 0.01, ***p < 0.001. All data were shown as mean ± SEM.
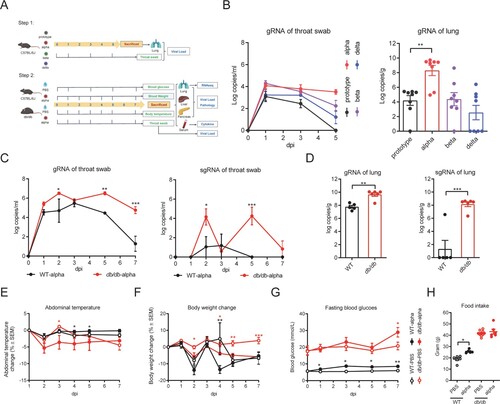
Figure 2. Pathological histology analysis shows aggravated lung, liver, and pancreas damage in db/db mice infected with SARS-CoV-2. WT and db/db mice were infected intranasally with 1 × 10⁵ PFU of the alpha strain or PBS. Lungs, livers, and pancreases were collected on 7 dpi. (A) H&E staining of lungs, livers and pancreas sections from WT-PBS, WT-alpha, db/db-PBS and db/db-alpha. Pathological score of lungs(B), livers(C) and pancreases(D). Data are presented as mean ± SEM. The difference between two groups were determined by Manna-Whitney test in non-parametric tests. *p < 0.05; **p < 0.01; ***p < 0.001. Each group contains 5–6 mice. Scale bar 100 μm.
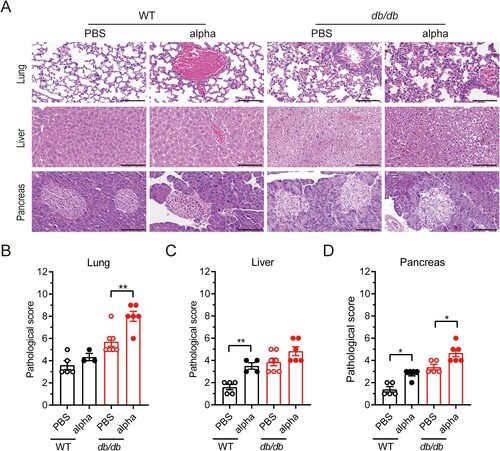
Figure 3. Inflammation related factor level and diabetic related cytokine level in serum was altered in db/db mice following SARS-Cov-2 infection. WT and db/db mice were infected intranasally with 1 × 10⁵ PFU of the alpha strain or PBS. Serum was collected on 7 dpi. Inflammation factors including (A) Eotaxin, (B) MCP-1, (C) G-CS, (D)KC, (E) IL-12(p40), (F) IL-5, and so on was determined using Bio-Plex PeoTM assays. Protein expression of diabetic related cytokine such as (G) insulin, (H) PAI-1, (I) leptin and so on was determined using Bio-Plex Mouse Diabetes assays. (J) HOMA-IR value of mice on 7 dpi. The difference between two groups was determined by unpaired t-test. *p < 0.05; **p < 0.01; ***p < 0.001. Each group contained 5–6 mice. All data was presented as mean ± SEM.
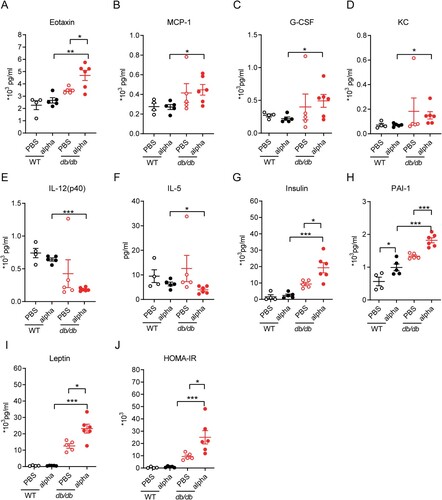
Figure 4. Analysis of immune-related DEGs in the lungs of db/db and WT mice after infection. (A) Veen diagram of DEGs in the infected db/db and WT mice and immune-related genes. DEGs were presented in blue, and immune-related genes were presented in red. (B) Heat map of expression of immune-related differential genes. (C) The network of GO enriched terms of DEGs. The term significant was presented by the node size: the biggest terms were the most significant ones. The proportion of associated upregulated or downregulated genes was showed with the node colour: red colour indicated more upregulated genes was enriched to the term, and blue colour indicated more downregulated genes. (D) FPKM values of some genes encoding immune cell surface antigens and cytokines in db/db and WT mice.
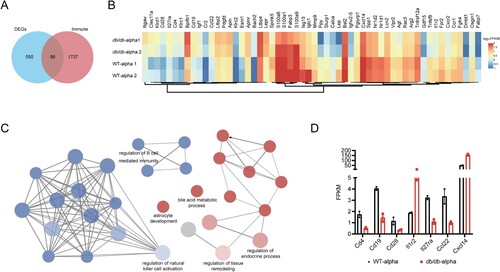
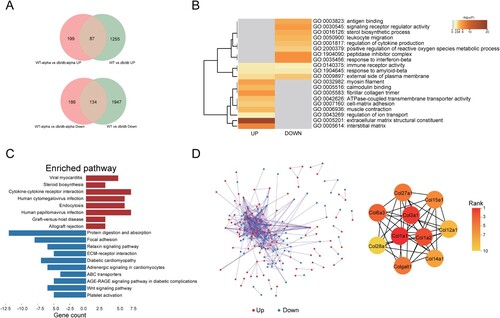
Figure 5. Analysis of SARS-CoV-2 related DEGs in the lungs of db/db and WT mice after infection. (A)Veen diagram of different genes. Genes of infected mice were presented in red, and genes of uninfected mice were presented in green. (B)The GO enrichment of upregulated DEGs and downregulate DEGs. The top 20 results were shown in heatmap. The darker the colour, the smaller the p-value. (C) The KEGG pathway enrichment analysis of DEGs. Results from KEGG enrichment of upregulated genes (red) and downregulated genes (blue) were showed in bar graph. (D) The PPI network of all DEGs. The upregulated genes were marked in red, while the down-regulated genes were marked in blue. Ten hub genes were identified with the MCC algorithm using cytoHubba.
Supplemental Material
Download MS Word (4.2 MB)Data availability
All study data are included in the article and/or supplementary material. The original data of RNA sequencing in this study is available at NCBI SRA under the accession number PRJNA929576.