Figures & data
Figure 1. Number of culture-confirmed melioidosis# in Hong Kong from Jan 2015 to Oct 2022. Note: #Data is retrieved from the Clinical Data Analysis and Reporting System (CDARS), Hospital Authority, Hong Kong. Each patient is counted once per year based on the first detection of the year. †From January to July 2022, 4 cases of melioidosis were diagnosed; from August to October 2022, an unusual upsurge of 18 cases of melioidosis was detected in the Kowloon West Cluster.
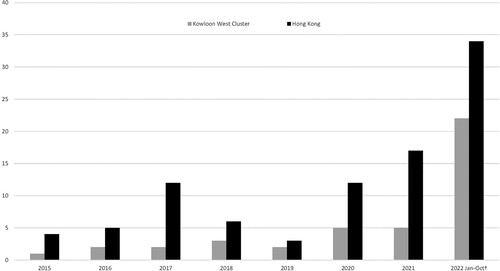
Table 1. Characteristics of patients with melioidosis and Burkholderia pseudomallei isolates in Kowloon West Region, Hong Kong, China, January 2015 to October 2022.
Figure 2. Phylogenetic analysis of 188 B. pseudomallei genomes (150 reference genomes and 38 genomes from isolates collected in this study). Maximum-likelihood phylogenies (mid-point rooted) of the SNPs of the 1646 single-copy cgMLST. Three monophyletic clades with more than one Hong Kong isolate identified are highlighted by colour blocks (grey: Clade 1, blue: Clade 2 and orange: Clade 3). Geographical location and sample host metadata of where the isolates were sampled were annotated and the sequence typing of the B. pseudomallei is denoted by circles next to the taxa. Bootstrap analysis of 1,000 replicates was performed and bootstrap values of selected nodes are shown (asterisk refers to 100%).
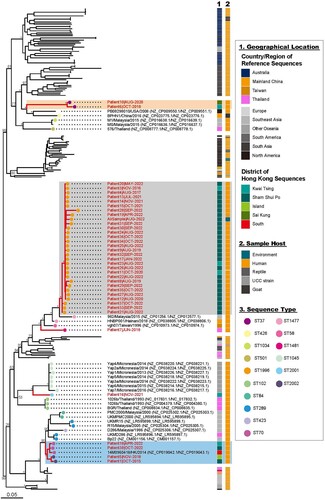
Figure 3. Timeline showing the hospital admission date of melioidosis cases from 2015 to 2022 and the respective rainfall intensity and tropical cyclone warning signal (3 or higher) recorded during this period.
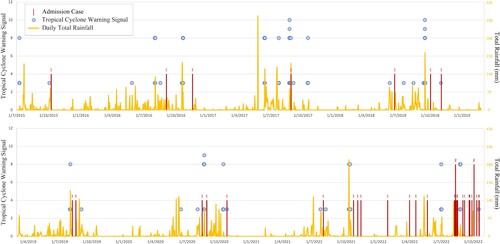
Table 2. Statistic correlation of prior typhoon and total rainfall with melioidosis cases in Kowloon West Region of Hong Kong (Jan 2015–Oct 2022) based on Poisson Regression analysis.
Figure 4. The geographic location of the melioidosis cases in KW region from 2015 to 2022. The collection sites of the positive air sample and soil samples were also marked on the map. The wind data during the collection of the positive air sample on 15 August, 2022, 10:00–11:00 am was retrieved from Hong Kong Observatory.
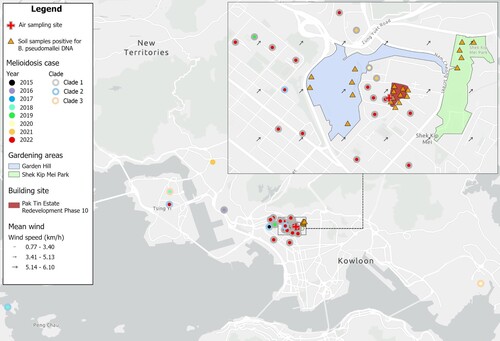
Figure 5. Krona plots showing the abundance estimates of bacterial 16s rRNA sequences in soil samples collected from the building site (Pak Tin Estate Redevelopment Phase 10), Garden Hill and Shek Kip Mei Park. Interactive krona charts can be found in Figure S1–S3.
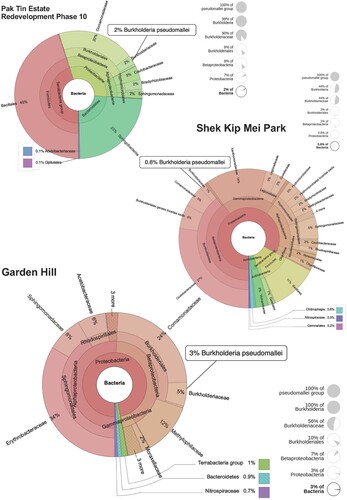
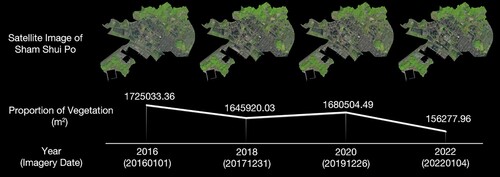
Figure 6. Estimation of the area of vegetation region in Shum Shui Po district from 2016–2022 using Sentinel-2 multispectral satellite imagery.