Figures & data
Figure 1. FL-NAH binding to the NSP14 MTase. (A) Chemical structure of FL-NAH. (B) SDS-PAGE analysis of purified NSP14, NSP14-NS10, and NSP16 of SARS-CoV-2, and ZIKV NS5. St, molecular weight standard; lane 1, NSP14; lane 2, SARS-CoV-2 NSP14-NSP10 complex; lane 3, SARS-CoV-2 NSP16; lane 4, ZIKV NS5. (C) Dose-dependent FL-NAH FP assay. FL-NAH (50 nM) was applied to 2-fold diluted concentration series of NSP14 and NSP14-NSP10 complex. FP was calculated by measuring the parallel and perpendicular fluorescence with excitation and emission wavelengths of 485 nm and 528 nm, respectively. N = 3. (D) Dose-dependent inhibition of FL-NAH binding to the NSP14 MTase by SAM and SAH. The NSP14 MTase was incubated with concentration series of SAM and SAH for 30 min. FL-NAH (50 nM) was added and further incubated for 30 min before fluorescence measurement. N = 3. FP values in the presence of SAM or SAH were normalized to that of the DMSO control (100%).
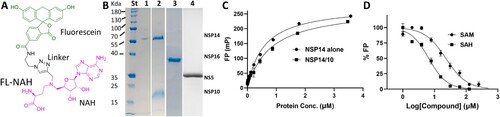
Figure 2. FP-based FL-NAH displacement HTS. (A) SAH (25, 31.25, or 50 µM) inhibited FL-NAH (50 nM or 30 nM) binding to the SARS-CoV-2 NSP14 (0.5 µM), ZIKV NS5 (2.5 µM), or SARS-CoV-2 NSP16 (0.5 µM) MTases in 96-well plate. ****, p < 0.0001. (B) FL-NAH FP HTS assay statistics against the NCI Diversity Set VI compound library. Scales for Z-factor and CV were on the left axis; scale for S/B was on the right axis. (C) Structures of NSC 111552 and 288387. (D) Dose-dependent inhibition of FL-NAH binding to the NSP14 MTase by NSC 111552 and 288387. N = 3. Assay was performed similarly as described in (D). FP values in the presence of compounds were normalized to that of the DMSO control (100%).
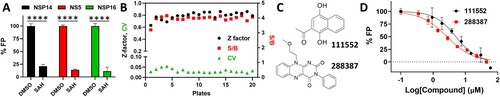
Table 1. Inhibition of FL-NAH binding to the SARS-CoV-2 NSP14 MTases (IC50-disp), inhibition of MTase activity (IC50-HTRF, IC50-TLC, IC50-MS), antiviral efficacy (EC50), and cytotoxicity (CC50) in Vero cells of compounds.
Figure 3. Functional NSP14 MTase activity assays. (A) Schematic figure to show the HTRF-based assay for MTase activity. SAM-dependent MTase produces SAH after transferring methyl group to its substrate. The released SAH displaces SAH-d2 from the variable region of an α-SAH Tb cryptate-conjugated antibody, leading to a decreased HTRF signal through the disruption of the Tb cryptate – d2 FRET pair. (B) HTRF analyses of dose-dependent inhibition of FL-NAH binding to the NSP14 MTase by compounds NSC 111552 and 288387. N = 3. TR-FRET values in the presence of compounds were reverse normalized to that of the (-) MTase control (0%) and that of the DMSO control (100%). (C) TLC analyses of dose–response inhibition of the N7 methylation activity of the SARS-CoV-2 NSP14 MTase by compound NSC 111552 and 288387. Upper panels, TLC analyses of inhibition of the SARS-CoV-2 NSP14 MTase by of NSC111552 (left panel) and NSC288387 (right panel). The migration positions of the G*pppA and m7G*pppA molecules are labeled on the side of the TLC images. Lower panels, curve fitting to determine the IC50 values for each compound on the N7 activities of the SARS-CoV-2 NSP14. The percentage of activity was determined after quantification of G*pppA and m7G*pppA. The IC50 value was determined by fitting of the dose−response curve. (D) MS analyses of dose−response inhibition of the N7 methylation activity of the SARS-CoV-2 NSP14 MTase by compound NSC 111552 and 288387.
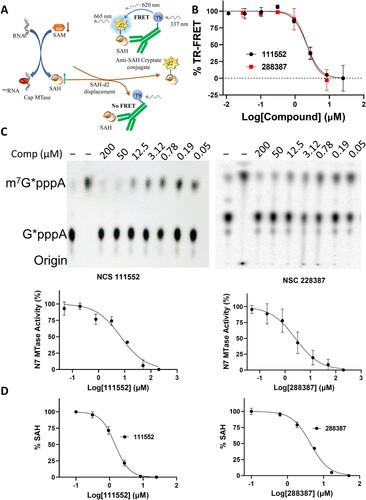
Figure 4. Analysis of Cytotoxicity and antiviral activity of compounds NSC 111552 and 288387. (A) Cytotoxicity of NSC 111552 (left panel) and 288387 (right panel). Vero cells were treated with various concentrations of NSC 111552 and 288387, followed by cell viability assay at 42 h post-incubation. N = 3. (B) Inhibition of SARS-CoV-2 replication by NSC 111552 (left panel) and 288387 (right panel). Vero cells were seeded in 96 well plated. After 24 h, media was replaced with fresh media containing indicated concentrations of NSC 111552 (left panel) and 288387 (right panel), followed by infection with SARS-CoV-2. At 72 h post-infection, wells were stained with crystal violet; and viral plaque were counted.
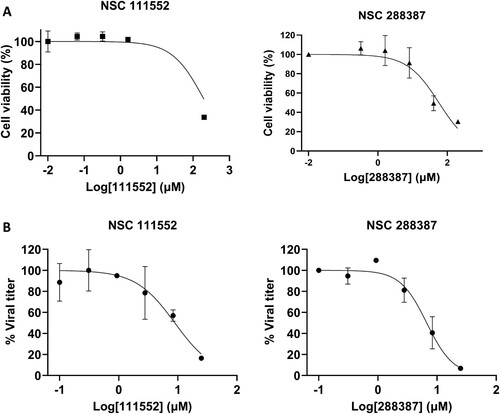
Figure 5. Immunofluorescence assay for detection of SARS-CoV-2 WT and Omicron-infected cells treated with NSC 111552 and 288387. (A,C) IFA images of dose-dependent inhibition of SARS-CoV-2 WT Washington Strain (WA) (A) and Omicron BA.1.1 strain (B) by compounds NSC 111552 and 288387. Vero E6 cells were infected with the SARS-CoV-2 WA strain (A and B) and the Omicron strain (C and D), treated with compounds at indicated concentrations for 24 h for the WA strain or 42 h for the Omicron strain, fixed and immunolabeled with a primary SARS-CoV-2 nucleocapsid monoclonal antibody and a goat anti-mouse secondary Alexa-488 antibody. Blue, DAPI staining. (B,D) Normalized IFA data shown in panels A and C. The intensities of Alexa-488 positive cells for the DMSO control were set as 100%. N = 3.
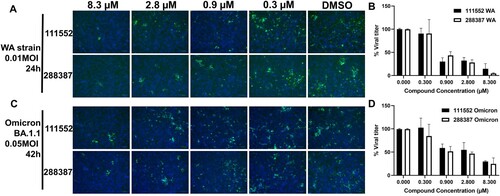
Figure 6. Synergy between inhibitors of NSP14 MTase, Mpro, and RdRp. (A,C) Topographic two-dimensional map of synergy scores for dose-response interaction matrix between NSC111552 and nirmatrelvir (A) and between NSC111552 and remdesivir (C), using Vero E6 cells against the SARS-CoV-2 WA strain in the presence of P-gp efflux inhibitor CP-100356 (2 µM) [Citation67–72]. The synergy scores were determined in SynergyFinder [Citation66] from the above checkerboard combination assay. (B,D) Dose-response of compounds alone and in combination with fixed concentration of one compound and varying that of the other. N = 3.
![Figure 6. Synergy between inhibitors of NSP14 MTase, Mpro, and RdRp. (A,C) Topographic two-dimensional map of synergy scores for dose-response interaction matrix between NSC111552 and nirmatrelvir (A) and between NSC111552 and remdesivir (C), using Vero E6 cells against the SARS-CoV-2 WA strain in the presence of P-gp efflux inhibitor CP-100356 (2 µM) [Citation67–72]. The synergy scores were determined in SynergyFinder [Citation66] from the above checkerboard combination assay. (B,D) Dose-response of compounds alone and in combination with fixed concentration of one compound and varying that of the other. N = 3.](/cms/asset/e9a47dee-badc-42e4-80f6-5a5acdbf9a1c/temi_a_2204164_f0006_oc.jpg)
Figure 7. Analysis of binding of NSC 111552 and 288387 to the SARS-CoV-2 NSP14 protein using MST. Dose-response curve was generated by fitting experimental data by titrating NSC 111552 and 288387 from 0.6 mM to 9.1 nM against NSP14 (40 nM). N = 3.
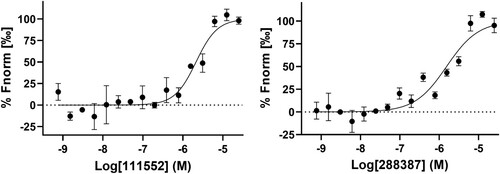
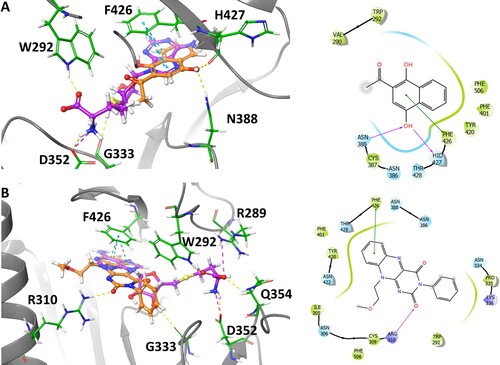
Figure 8. Binding interaction of NSC 111552 and 288387 with NSP14. (A) 3D overlay of NSC111552 (orange) with SAH (purple) (left) with the 2D interaction diagram of 111552 (right). (B) 3D overlay of NSC288387 (orange) with SAH (purple) (left) with the 2D interaction diagram of 288387 (right).