Figures & data
Figure 1. Human astrocytes are susceptible to RVFV infection. (A) Mock and RVFV-infected cells (MRU25010-30 and Mayotte 2008, MOI 0.1) were fixed at two days post-infection (dpi) and labelled with a monoclonal anti-N RVFV antibody (red), anti-GFAP antibody (green), and DAPI (blue) (scale bar 100 µm). (B) RVFV-infected cells (%) analysed by counting infected labelled cells compared to total cells number at 2 dpi (counting ≥1000 cells, n = 7, t-test: ****p-value < .0001).
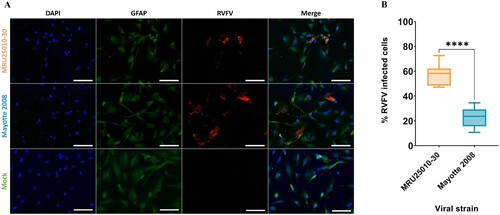
Figure 2. RVFV replicates in human astrocytes. Supernatants of mock- and RVFV-infected cells (MRU25010-30 and Mayotte 2008, MOI 0.1) were harvested at different time points post-infection and titrated using the TCDI50 method (Red arrow: removal of inoculum). Dotted square shows early infection time points. Results are expressed as geometric mean ±95% confidence interval (CI) and ANOVA two-way test show significance between each strain at each time point (black) or show significance between two time points for one strain (coloured, early times dotted square) (p-value: *p < .05, **p < .01, ***p < .001, ****p < .0001).
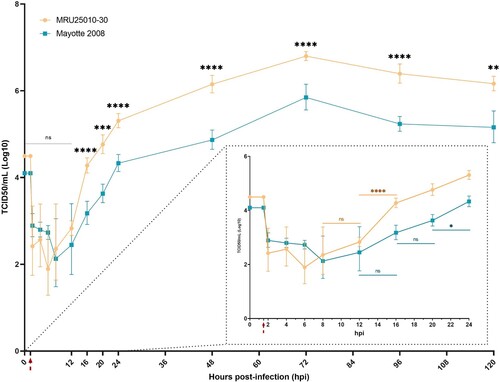
Figure 3. RVFV astrocyte infection induces early cell toxicity but a delayed apoptosis. (A) Cell morphology after RVFV infection analysed by phase contrast microscopy (scale bar 100 µm) at different days post-infection (dpi) in mock- and RVFV-infected cells (MRU25010-30 and Mayotte 2008, MOI 0.1). (B) Annexin V staining of mock and RVFV-infected cells (MRU25010-30 and Mayotte 2008, MOI 0.1) at different time points and measured by FACS. Results show percentage of cells positive for Annexin V expressed in mean ±95% confidence interval (Mann–Whitney: *p-value < .05, **p-value < .01).
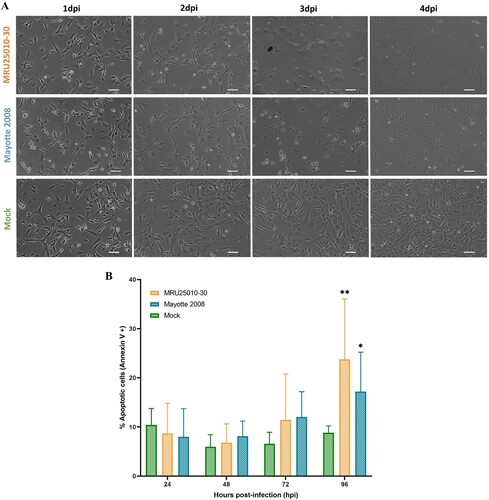
Figure 4. RVFV infection of astrocytes induces an early activation of caspase 3 and its potential intranuclear sequestration by NSs filaments. (A) Monitoring of cell apoptosis using mock-, H2O2 pre-treated – and RVFV-infected astrocytes (MRU25010-30 and Mayotte 2008, MOI 0.1) fixed at two days post-infection (dpi) and labelled with anti-cleaved caspase 3 antibody (green, Cas3), anti-RVFV antibody (red), and DAPI (blue) (scale bar 50 µm), (B) Quantification of apoptosis in RVFV-infected astrocytes (MRU25010-30 and Mayotte 2008, 2 dpi, MOI 0.1) by counting cleaved-caspase 3 labelled cells compared to total cell number (counting ≥ 1000 cells, n = 6, t-test: ****p-value < .0001). (C) Fluorescence intensity plots (bottom plots) measurement of indirect IFA pictures (top pictures, scale bar 200 µm) with anti-cleaved caspase antibody (green) and anti-RVFV antibody (red) in mock and infected conditions (MRU25010-30 and Mayotte 2008, 2 dpi, MOI 0.1). Intensity of fluorescence is calculated for each pixel in horizontal distance and for anti-RVFV signal (red) and anti-cleaved-caspase 3 signal (green). (D) RVFV NSs interaction with cleaved-caspase 3 was assay with mock and RVFV-infected astrocytes (MRU25010-30, Mayotte 2008 and Clone 13, MOI 0.1) fixed at 2 dpi. Cells were labelled with anti-NSs antibody (red), anti-cleaved caspase 3 antibody (green), and DAPI (blue) (scale bar 50 µm, small scale bar 4 µm). Yellow labelling corresponding to the colocalization of cleaved-caspase 3 and NSs (examples of colocalization by white arrows).
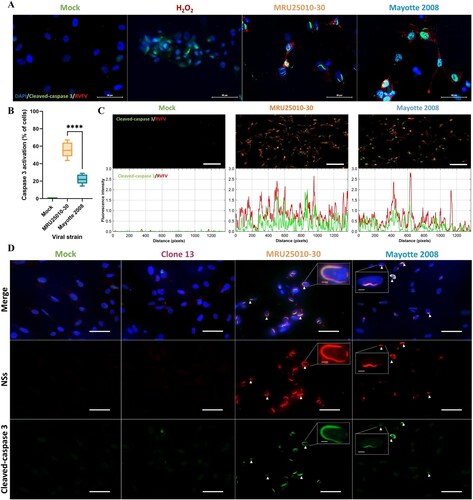
Figure 5. Astrocytes infection by RVFV induces inflammatory and antiviral responses at the mRNA level but not at the protein level. (A) Analyse of immune response induced by RVFV-infected astrocytes (MRU25010-30 and Mayotte 2008, MOI 0.1) after 48 h post-infection (hpi) assayed by measuring gene mRNA upregulated (green) or downregulated (red) expression with RT-qPCR using fold-change method standardized on housekeeping genes. All presented results have a p-value < .05 (t-test) or ns for non-significant. (B) Cytokines secreted in RVFV-infected astrocytes (MRU25010-30 and Mayotte 2008, MOI 0.1, 2 dpi) were measured using FACS multiplex assays (LOD: Limit of Detection) and compared to mock concentration (Mann–Whitney test compared to mock concentration, p-value: *p < .05, **p < .01, ***p < .001, ****p < .0001, with black bar for both strains, and without a bar when only one strain is considered).
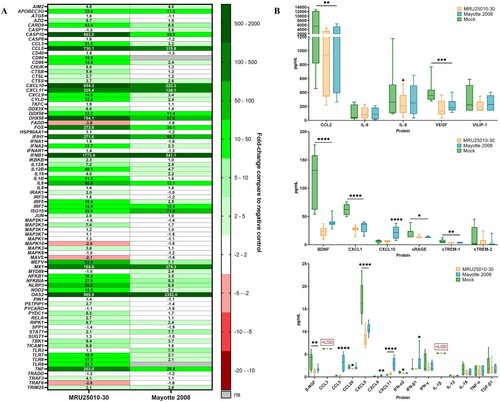
Figure 6. NSs potentially modulates astrocytes immune response by interfering with mRNA translation. (A) Comparison between mRNA and protein expression levels after 48 h post-infection (hpi) for specific genes: mRNA levels are expressed in fold-change and protein level with a ratio of mean protein concentration between infected and mock conditions. If protein ratio was under 1, value is expressed after −1/X conversion. (B) Kinetic of expression of inflammatory cytokines of RVFV-infected astrocytes (MRU25010-30, Mayotte 2008 and Clone 13, a NSs-delated natural strain, MOI 0.1). Measurements of protein concentration were done using FACS multiplex assays (LOD: Limit of Detection) at 24, 48, and 72 hpi. Results show protein concentration expressed in mean ±95% confidence interval (Mann–Whitney test compared to mock concentration, p-value: *p < .05, **p < .01, ***p < .001, ****p < .0001).
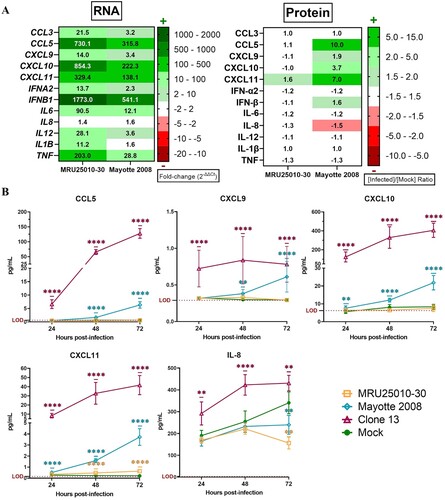
Figure 7. NSs potentially modulate immune response by inhibiting mRNA export from nucleus to cytoplasm. Relative quantities of mRNA related to housekeeping gene (HPRT1), to other cellular factors (BDNF, NGF, VEGF) or to immune response genes (CCL5, CXCL10, CXCL11, IFNB1, IL6, IL1B, TNF) were explored in the different cell compartments by RT-qPCR on RVFV-infected astrocytes (MRU25010-30, Mayotte 2008 and Clone 13, a NSs-delated natural strain, MOI 0.1). After 48 h of RVFV infection, cell fractionation was performed on astrocytes to get separate cytoplasm and nucleus components followed by total RNA extraction. Relative quantification of mRNA was performed by RT-qPCR: the mean of Ct values ±95% confidence interval from cytoplasm and nucleus at each condition is mentioned on the right side of the figure. To determine nuclear export of specific genes, a ΔCt ratio was calculated for each sample by subtracting the Ct value of cytoplasm by the Ct value of nucleus. Mean of this ΔCt ratio and statistical values is represented as a heatmap (ANOVA two-way, test compared to mock ΔCt ratio, p-value: nsp > .05, *p < .05, ***p < .001, ****p < .0001).
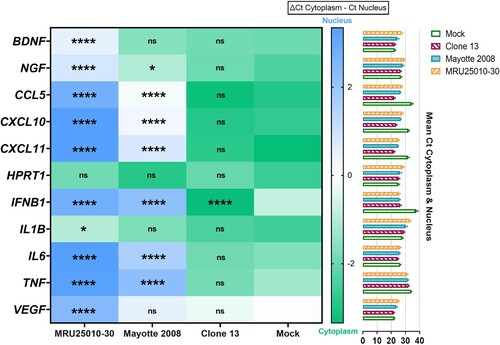
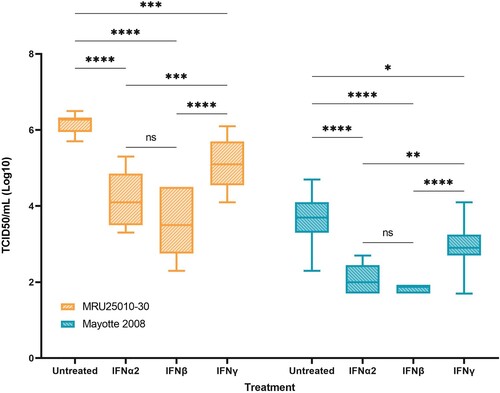
Figure 8. Type I and type II responses inhibit RVFV replication. In order to explore the role of the antiviral response induced by infected astrocytes on RVFV infection, RVFV titers of IFN pre-treated astrocytes (IFN-α2, IFN-β, and IFN-γ) are compared to pre-treated controls (medium only), 24 h post-infection with the two RVFV strains MRU25010-30 and Mayotte 2008. Viral titres were determined by TCID50 method (ANOVA two-way: p-value: *p < .05, **p < .01, ***p < .001, ****p < .0001).