Figures & data
Figure 1. Omicron BA.2 or Delta virus infection in the respiratory tissues of newly-weaned or mature hamsters. (A) Viral genomic RdRp gene copies and infectious virus titre in the NT. n = 3–8. (B) Viral genomic RdRp gene copies and infectious virus titre in the lung tissues. n = 3–8. Dashed lines are indicated as detection limits. (C) Basal mRNA expression levels of pro-inflammatory cytokine/chemokine in lung of mock newly-weaned or mature hamsters. n = 3–5. (D) Relative mRNA expression levels of pro-inflammatory cytokines/chemokines in the lung tissues. n = 3–12. (E) Serum concentrations of IL-6, TNF-α, and CXCL10 at 4 dpi. n = 3–7. (F) Representative H&E images of lungs of mock control and Omicron BA.2 or Delta infected newly-weaned hamsters at 4 dpi. Scale bar = 500 µm. (G) Representative H&E images of NT, trachea, and lung of Omicron BA.2 or Delta infected newly-weaned hamsters at 4 dpi. Areas in the numbered squares were magnified, respectively. Scale bars = 500, 200, 50 µm. (H) Semiquantitative scores for histological changes in hamster lungs at 4 dpi. n = 5–14. Data represented mean ± SD. *p < 0.05, **p < 0.01, ***p < 0.001, ****p < 0.0001, by Two-way (A–D) or One-way (H) ANOVA.
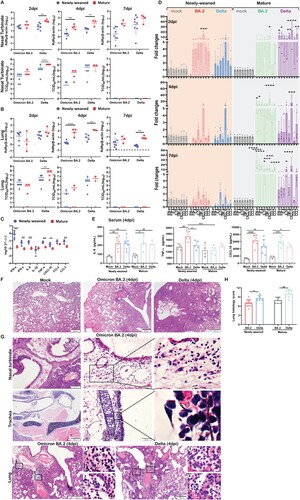
Figure 2. SARS-CoV-2 viral RNA and antigen expression in newly-weaned or mature hamster brain tissues after Omicron BA.2 or Delta virus infection. (A) Viral Sg-E gene copies in brain tissues. n = 3–8. (B) Infectious virus titre in brain tissues. n = 3–8. Data represented mean ± SD. Dashed lines indicated as detection limits. (C) Immunohistochemistry stained SARS-CoV-2 viral N protein in brain sections of Omicron BA.2 infected newly-weaned hamsters at 4 dpi. The positive cells in the boxed area were magnified and indicated by arrows. Scale bar = 50 µm. (D) Immunofluorescence stained SARS-CoV-2 viral N protein in brain sections of Omicron BA.2 infected newly-weaned hamsters at 4 dpi. N protein-positive cells stained in green fluorescence and indicated by arrows. The positive cells in the boxed area were magnified. Scale bar = 100 µm. (E) Double immunofluorescence stained N protein antigen (green) and microglial cellular marker Iba1 (red) in brain sections of Omicron BA.2 infected newly-weaned hamsters at 4 dpi. Iba1 and N antigen double-positive cells in boxed areas were magnified and indicated by arrows. Scale bar = 50 or 100 µm. (F) Double immunofluorescence staining of N antigen and neuron marker Tuj1 in brain tissue of Omicron BA.2 infected newly-weaned hamsters at 4 dpi. Tuj1 and N antigen double-positive cells in the insert. (G) Immunofluorescence stained N protein in brain tissue sections of Omicron BA.2 infected mature hamsters at 4 dpi. N protein-positive cells stained in green fluorescence and indicated by arrows. The positive cells in the boxed area were magnified. Scale bar = 50 µm (F&G).
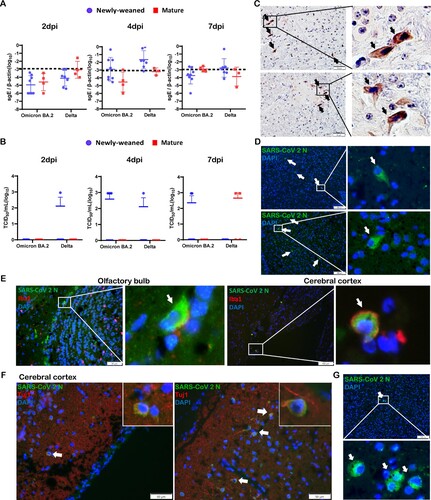
Figure 3. Pro-inflammatory cytokine/chemokine responses in brains of mock control, Omicron BA.2 or Delta virus-infected hamsters. (A) Relative mRNA expression levels of pro-inflammatory cytokines/chemokines in Omicron BA.2 or Delta infected newly-weaned or mature hamster brain tissues at 2, 4 and 7 dpi. n = 3–14. (B) Relative mRNA expression levels of CCL2, CCL3, CCL11, CCR2, CCR3, and CCR5 in the brain tissues. n = 3–12. (C) CSF concentrations of TNF-α and CXCL10 at 4 dpi. n = 3–5. Data represented mean ± SD. *p < 0.05, ***p < 0.001, ****p < 0.0001, by Two-way ANOVA.
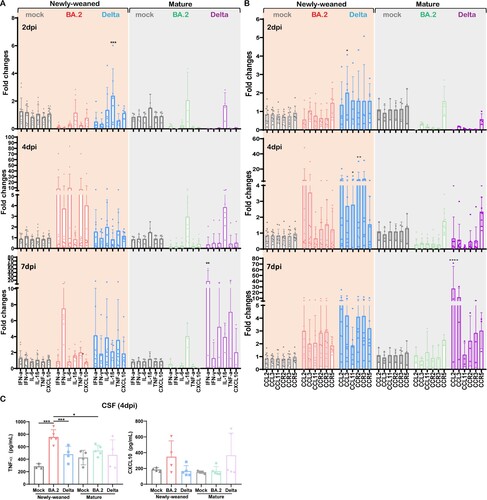
Figure 4. Histological changes of inflammation in the brain tissues of newly-weaned hamsters after Omicron BA.2 or Delta virus infection. (A) Representative H&E images of meninges of newly-weaned hamsters from mock control or SARS-CoV-2 infected hamsters. The meninges showed vascular congestion and inflammatory cell infiltration at 7 dpi after Omicron BA.2 or Delta virus infection. Boxed areas were magnified in the lower panel. Scale bar = 200 µm (upper panel), 50 µm (lower panel). (B) Representative H&E images of cerebral cortex from mock control (left) or SARS-CoV-2 infected newly-weaned hamsters. Cerebral cortex showed vascular congestion and increased cellularity around vessel wall (middle) and small haemorrhagic foci (right) at 7 dpi. Scale bar = 100, 50 µm. (C) The H&E images of OB of Omicron BA.2 infected newly-weaned hamsters at 7 dpi showed microglia accumulation around the blood vessel (upper panel). Images labelled with 1&2 are two boxed areas magnified. The images in the lower panel showed microgliosis in the cerebral cortex of Omicron BA.2 infected newly-weaned hamsters at 7 dpi. Scale bar = 50 µm. (D) Semiquantitative scores for histological changes in hamster brains. The scores for each category of brain histological changes (upper) and the total scores were presented (lower). n = 3–8. (E) Representative images of immunofluorescence stained microglia with Iba1 antibody in OB, cerebral cortex and hippocampus of Omicron BA.2 or Delta infected newly-weaned hamster brains at 7 dpi. Microglia were stained red in the brain parenchyma. Magnified Iba1-positive cells in the insert. Scale bar = 50 µm. (F) The number of Iba1-positive microglia in brain sections in different anatomical regions obtained by quantitative image analysis. 10–20 microscopic fields at 400× magnification from different anatomic regions were counted for each sample. n = 3–4. (G) Relative mRNA expression levels for genes regulating activation of microglia and astrocytes in Omicron BA.2 or Delta infected newly-weaned or mature hamster brains at 2, 4, and 7 dpi. n = 3–8. Data represented mean ± SD. *p < 0.05, **p < 0.01, ***p < 0.001, ****p < 0.0001 when comparing with mock control by One-way (D&F) or Two-way ANOVA (G).
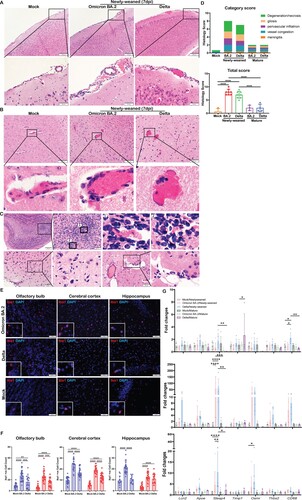
Figure 5. Neuron degenerative and necrotic changes in the hippocampus and DG of newly-weaned hamsters infected by Omicron BA.2 or Delta virus at 7 dpi. (A) Representative images with high magnifications showing the neuron degenerative changes (solid arrows) frequently observed in the brains of Omicron BA.2 infected newly-weaned hamsters at 4 or 7 dpi. Open arrows indicated normal neurons in olfactory cortex, hippocampus, cerebral cortex, and cerebellum, respectively. Scale bar = 50 µm. (B) Representative images of hippocampus of mock, Omicron BA.2 or delta virus-infected newly-weaned hamsters at 7 dpi. The anatomical sub-regions of hippocampus, cornu ammonis 1, 2, 3 (CA1, CA2, CA3) and DG sub-regions of the hippocampus are labelled. Mock control hamster hippocampus showed normal morphology of neurons in the CA3 and DG sub-regions (open arrows). At 7 dpi, among the normal neurons (open arrows), degenerative and necrotic pyramidal neurons were shown as dark coloured, shrunk cell body with pyknotic nuclei (solid arrows); the DG area of infected hamsters showed neuron degeneration with dark coloured, shrunken cell body in Omicron BA.2 infected newly-weaned hamster, and also vacuolated degeneration in Delta infected newly-weaned hamster (magnified degenerative neurons in the insert) Scale bar = 200, 50 µm.
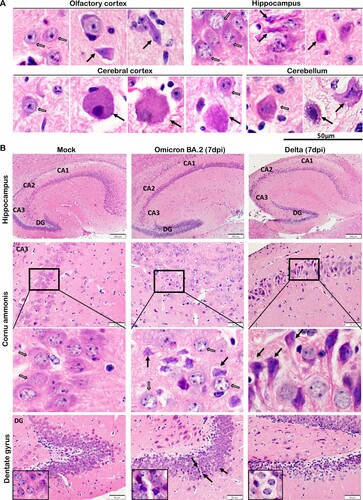
Figure 6. Neuron degenerative and necrotic changes in the OB, cerebral cortex and cerebellum of newly-weaned hamsters infected by Omicron BA.2 or Delta virus at 7 dpi. (A) Representative images of OB (OB) magnified to show the mitral cell layer (MCL) in mock, Omicron BA.2, or Delta virus-infected newly-weaned hamsters at 7 dpi. Further magnified MCL in squared areas showed normal mitral cells with pyramidal shape, abundant cytoplasm and vesicular nuclei in mock control hamster (open arrows), and the cluster of small sized granule nerve cells in round shape with scanty cytoplasm and dark nuclei. While in infected newly-weaned hamster brain, degenerated neurons in MCL showed dark and shrunken nuclei (solid arrows) and accumulated glial cells. Scale bar = 50 µm. (B) Representative images of cerebral cortex of mock control, Omicron BA.2 or Delta virus-infected newly-weaned hamsters at 7 dpi. In mock control brain, the normal morphology of neurons was indicated by open arrows in a magnified image of the squared area. In Omicron BA.2 or Delta infected newly-weaned hamster brain, pyramidal neurons showed degenerative changes with ballooning cell body and loss of nuclei (arrows in Omicron BA.2, 7 dpi); some degenerative neurons showed eccentric shape, dark and shrunken nuclei (solid arrows, in Delta 7 dpi). Scale bar = 50 or 100 µm. (C) Representative images of H&E stained hamster cerebellum. Normal morphology of molecular layer and granular layers were shown in the mock controls at lower magnification. Magnified images of granular layer in the squares showed normal granule cells and Purkinje neurons (open arrows). The cerebellum of hamster infected by Omicron BA.2 or Delta virus at 7 dpi showing a some Purkinje cells degeneration (solid arrows) among the normal Purkinje cells (open arrows). Scale bar = 50 µm.
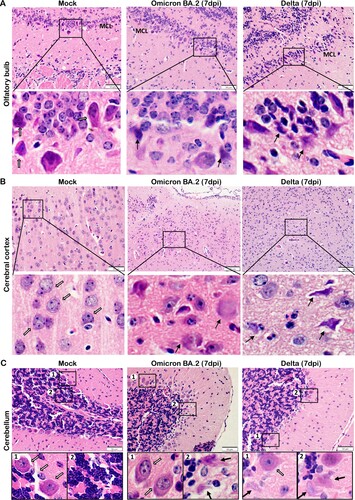
Figure 7. TUNEL staining in the brain tissues of newly-weaned hamsters infected by Omicron BA.2 or Delta virus at 7 dpi. (A) Representative images of different brain structure stained by TUNEL. Mock control hamster brain, from left to right, OB, cerebral cortex, hippocampus, and cerebellum showed no TUNEL labelled cells. TUNEL staining images of Omicron BA.2 (left two panels) and Delta (right two panels) infected newly-weaned hamsters brain tissue at 7 dpi showing TUNEL-positive cells (in green). Positive cells in the squared area were magnified and shown on the right. Scale bar = 100 µm. (B) Representative images of increased TUNEL-positive ependymal cells lining the lateral ventricle in newly-weaned hamster brain after Omicron BA.2 infection at 7 dpi. Positive cells in numbered squared areas were magnified and shown on the right. Scale bar = 200 µm.
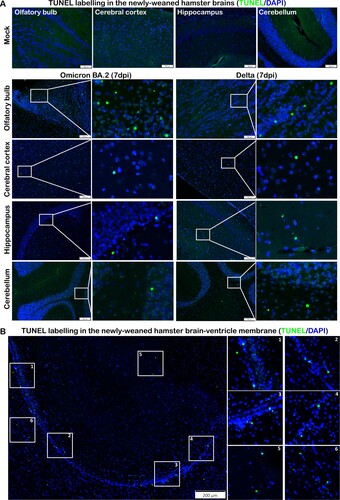
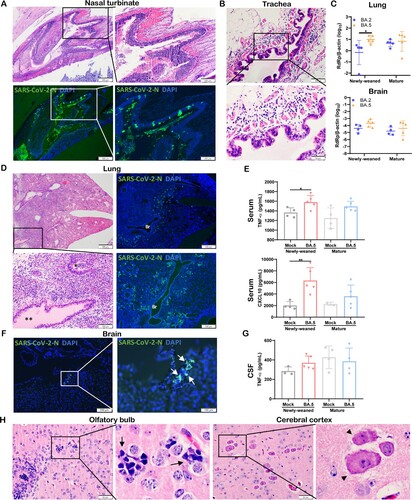
Figure 8. Omicron BA.5 infection in the respiratory and brain tissues of newly-weaned hamsters at 4 dpi. (A) Representative H&E images (upper panel) and immunofluorescence stained SARS-CoV-2 N protein images (lower panel) of NT after Omicron BA.5 infection of newly-weaned hamsters. Scale bar = 500, 200 µm. (B) Representative H&E images of trachea tissue sections of Omicron BA.5 infected newly-weaned hamster showing submucosal tissue oedema and inflammatory infiltrate including eosinophils infiltration. Scale bar = 100, 50 µm. (C) Viral RdRp gene copies in homogenized lung tissues or brain tissues of Omicron BA.2 or BA.5 infected newly-weaned and mature hamsters at 4 dpi. n = 5. Data represented mean ± SD. *p < 0.05, by Two-way ANOVA. (D) Representative images of H&E the lung tissues of Omicron BA.5 infected newly-weaned hamsters at 4 dpi. Squared area was magnified showing abundant secretion filling the lumen of bronchiole (**). The immunofluorescence stained images showing SARS-CoV-2 N antigen expression in the lung of BA.5 infected newly-weaned hamsters. “Br” indicates bronchiolar section. Scale bar = 500, 100 µm. (E) Serum concentrations of TNF-α and CXCL10 of mock or BA.5 infected hamsters at 4 dpi. Data represented mean ± SD. n = 4–5. Data represented mean ± SD. *p < 0.05, **p < 0.01 by One-way ANOVA. (F) Images of immunofluorescence stained viral N protein in the brain of BA.5 infected newly-weaned hamster at 4 dpi showing N antigen expression at the epithelium of circumventricular organ (arrows in magnified image). Scale bar = 200, 100 µm. (G) CSF concentrations of TNF-α in Omicron BA.5 infected hamsters at 4 dpi or mock controls. n = 4–5. (H) Representative H&E images of brain tissue sections of Omicron BA.5 infected newly-weaned hamsters at 4 dpi showing microgliosis in OB (arrows in magnified image) and neuron degeneration in cerebral cortex (arrowheads in magnified image). Scale bar = 50 µm.