
Figures & data
Figure 1. PDCoV spreads via cell-to-cell transmission in cell culture. (A) IPI-2I and ST cells were infected with PDCoV (MOI = 1) for 18 h. Cells were harvested and subjected to IFA with anti-PDCoV N antibody. Cell nuclei were stained with DAPI (blue). Scale bar, 100 μm. (B) Schematic representation of cell-to-cell and non-cell-to-cell infection assays (see details in Materials and Methods). (C) IPI-2I cells were infected with PDCoV (MOI = 1) for 12 h, collected, and added to target cells (cell-to-cell model) or Transwell inserts (non-cell-to-cell model). Cells were harvested for RT-qPCR assay at 2, 6, 12, 18, 24, 30 h post-coculture. (D, E) IPI-2I cells were infected with PDCoV (MOI = 1) for 12 h, then mixed with CMFDA-labelled target IPI-2I cells in the presence or absence of 1% methylcellulose or cultured separately with uninfected target cells by Transwell filters. After 24 h of coculture, cells were harvested and subjected to IFA (D) or TCID50 assay (E). (F) Cell-to-cell and non-cell-to-cell infection assays were performed on IPI-2I and ST cells as described in panel C. At 24 h post-coculture, ratios between cell-to-cell and non-cell-to-cell infection of PDCoV in IPI-2I and ST cells are displayed in stacked bars. Data represent means ± SD from three independent experiments. ***, P < 0.001; ns, not significant.
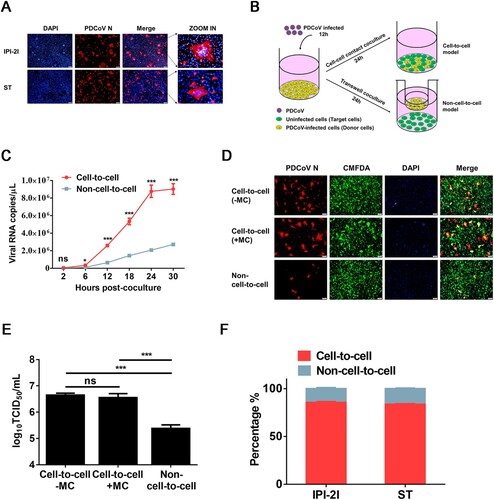
Figure 2. PDCoV-producing IPI-2I cells transmit virus to non-susceptible cells through cell-to-cell transmission. PDCoV-infected IPI-2I cells were cocultured with CMFDA-labelled Vero (A, C, E) and BHK-21 (B, D, F) cells. Cells were collected at 12, 24, 36 h post-coculture for IFA (A, B), flow cytometry (C, D), and RT-qPCR (E, F). (A, B) Cells were subjected to IFA with anti-PDCoV N antibody. Red arrows indicate syncytia formation in Vero (A) and BHK-21 (B) cells. Scale bar, 100 μm. (C, D) Cells were suspended in DMEM for sorting via flow cytometry. Flow cytometry dot plots show the percentage of Vero (C) and BHK-21 (D) cells in the cocultured cells. (E, F) RT-qPCR for detecting the viral RNA copy numbers in Vero (E) and BHK-21 (F) cells obtained by flow cytometry. Scale bar, 100 μm. Data represent means ± SD from three independent experiments.
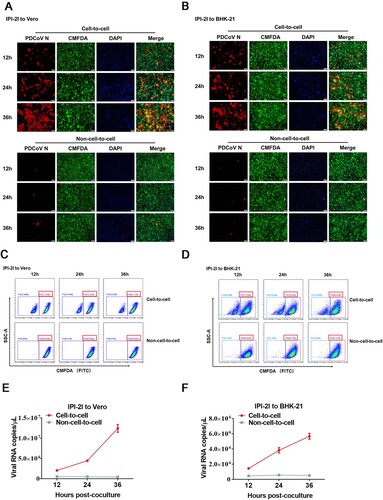
Figure 3. Cell–cell fusion mediated by PDCoV S protein contributes to cell-to-cell transmission. (A) PDCoV-infected IPI-2I cells were mixed with uninfected IPI-2I cells and cocultured in the presence of indicated concentrations of EK1C4 for 24 h, followed by IFA. Scale bar, 100 μm. (B) Numbers of nuclei per syncytium in panel A are displayed in the scatter plot. (C) Schematic diagram of luciferase-based cell–cell fusion assay (see details in Materials and Methods). (D, E) HEK-293T (D) and IPI-2I (E) cells were co-transfected with pBind-Id, PACT-Myod, and increasing quantities of pUC57-EF-1α-S expression plasmids or empty vector and cocultured with pGl5-luc-expressing cells for 48 h, followed by dual-luciferase assay. The expression of S protein and β-actin was detected via western blotting assay with antibodies against PDCoV-S and β-actin, respectively. β-actin served as a protein loading control. (F) HEK-293T cells were co-transfected with pUC57-EF-1α-S, pBind-Id, and PACT-Myod and mixed with other HEK-293T cells co-transfected with pGl5-Luc and pRL-TK. Cells were cocultured in fresh media containing 10 nM or 50 nM EK1C4 or DMSO. After 48 h of coculture, cell–cell fusion was evaluated by dual-luciferase assay. Expression of S protein and β-actin was detected via western blotting. (G) PDCoV-infected IPI-2I cells were cocultured with uninfected IPI-2I cells with 50 nM EK1C4 or DMSO for 24 h, followed by RT-qPCR assay. (H) Ratio of cell-to-cell transmission to total infection is calculated in panel G. Data represent means ± SD from three independent experiments. *, P < 0.05; **, P < 0.01; ***, P < 0.001; ns, not significant.
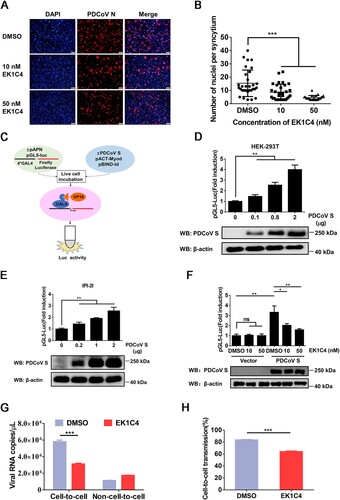
Figure 4. pAPN enhances cell-to-cell transmission of PDCoV. (A, B) HEK-293T (A) and IPI-2I cells (B) were co-transfected with pBind-Id, PACT-Myod, and 1 µg of pUC57-EF-1α-S or empty vector and cocultured with pGl5-luc-expressing cells transfected with 1 µg of pCAGGS-Flag-pAPN or pCAGGS-Flag. Dual-luciferase assay was performed at 48 h after coculture. The expression of pAPN, PDCoV S, and β-actin was verified via western blotting. (C) IPI-2I cells were transfected with 1 µg of pCAGGS-Flag-pAPN or pCAGGS-Flag. At 24 h post-transfection, transfected cells were mixed with PDCoV-infected IPI-2I cells, followed by coculture for 24 h. Cells were harvested for RT-qPCR assay. (D) IPI-2I or IPI-pAPNKO cells were transfected with indicated plasmid and cocultured for 48 h. Cell–cell fusion was evaluated by dual-luciferase assay. Expression of endogenous pAPN and PDCoV was detected by western blotting. (E) PDCoV-infected IPI-2I cells were cocultured with uninfected IPI-2I or IPI-pAPNKO cells for 24 h, followed by IFA for detecting syncytium formation. Scale bar, 100 μm. (F) Numbers of nuclei per syncytium in panel E are displayed in the scatter plot. (G) Uninfected IPI-pAPNKO cells or IPI-2I cells were mixed with PDCoV-infected IPI-2I cells, cocultured for 24 h, and subjected to RT-qPCR assay. (H) Ratio of cell-to-cell transmission to total infection is calculated in panel G. Data represent means ± SD from three independent experiments. *, P < 0.05; **, P < 0.01; ***, P < 0.001; ns, not significant.
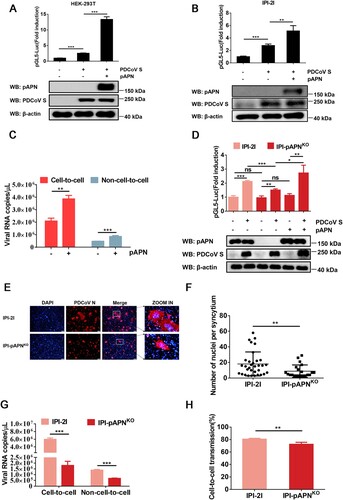
Figure 5. Cathepsins in endosomes are involved in cell-to-cell transmission of PDCoV. (A) IPI-2I cells cultured in 96-well plates were incubated with leupeptin (50 µM), Baf-A1 (50 nM), E64d (25 µM), Z-FY-CHO (20 µM), or CA-074 (5 µM). After 24 h incubation, 10 μl of CCK-8 was added to the cells and incubated for 1 h at 37°C, followed by measurement of OD value at 450 nm. (B, C) Cell-to-cell (B) and non-cell-to-cell (C) infection assays were performed on IPI-2I cells as described in the legend of , except that indicated inhibitors were present during the infection period. At 24 h post-coculture, cells were harvested and subjected to RT-qPCR assay. Ratios of relative infection were plotted by setting mock group values to 100. (D) PDCoV-infected IPI-2I cells were mixed with uninfected IPI-2I and cocultured in the presence of indicated concentration of inhibitors used in panel A for 24 h, followed by IFA for detecting syncytium formation. Scale bar, 100 μm. (E) Nuclei in each syncytium in panel D were counted. (F) Luciferase-based cell–cell fusion assays were performed on HEK-293T cells as described in the legend of D, except that indicated concentration of inhibitors used in panel A were included during coculture. Data represent means ± SD from three independent experiments. *, P < 0.05; **, P < 0.01; ***, P < 0.001; ns, not significant.
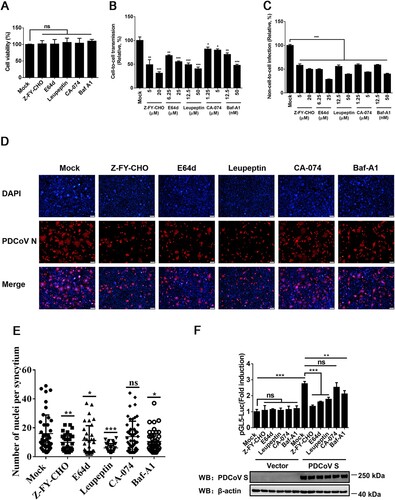
Figure 6. Cell-to-cell transmission of PDCoV is refractory to NmAbs. (A) Cell-to-cell and non-cell-to-cell assays were carried out on IPI-2I cells as described in the legend of , except indicated concentrations of NmAb-1, -2, or -3 were included during the infection period. Relative viral RNA copy numbers were plotted by setting the values of the control monoclonal antibody group to 100% for statistical analyzes. (B) PDCoV-infected cells were mixed with uninfected IPI-2I cells and cocultured in the presence of indicated concentration of NmAbs. Photos of syncytia formation were taken at 24 h after coculture and presented. (C) Numbers of nuclei per syncytium in panel B were determined and displayed in the scatter plot. (D) Luciferase-based cell–cell fusion assays were performed in HEK-293T cells as described in the legend of D, except that indicated concentration of NmAbs were included during coculture. Data represent means ± SD from three independent experiments. *, P < 0.05; **, P < 0.01; ***, P < 0.001; ns, not significant.
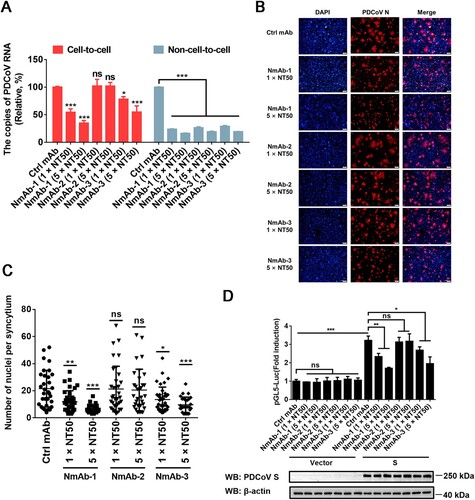
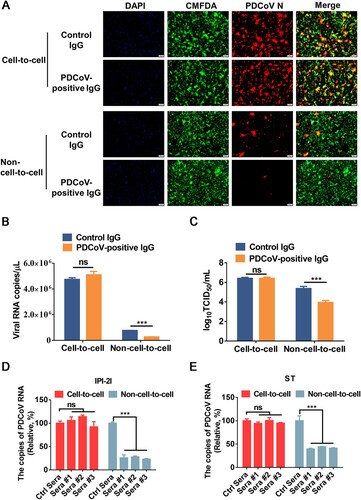
Figure 7. Cell-to-cell transmission of PDCoV is resistant to immune sera. (A-C) PDCoV-infected IPI-2I cells were mixed with uninfected IPI-2I cells and cocultured in the presence of PDCoV-positive IgG or control IgG for 24 h. The cells were collected and subjected to IFA (A), RT-qPCR (B), or TCID50 assay (C). (D, E) PDCoV-infected IPI-2I (D) and ST (E) cells were cocultured with IPI-2I and ST cells separately in the presence or the absence of immune sera for 24 h. Relative viral RNA copy numbers were plotted by setting the values of control sera group to 100% for statistical analyzes. ***, P < 0.001. ns, not significant.
Data availability statement
The data that support for the findings of this study are all contained in the manuscript.