Figures & data
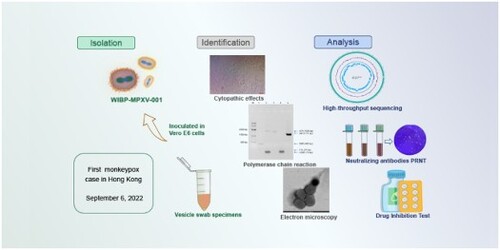
Figure 1. Isolation and identification of WIBP-MPXV-001. (A) Cytopathic effects of Vero and Vero E6 cells at 24, 48, and 72 hpi, with cell control. (B), (C) RT-PCR amplification plot and cycle threshold of culture suspension and infected cells. (D) Electron microscopy of WIBP-MPXV-001. (E) Conventional polymerase chain reaction products of WIBP-MPXV-001. M, size maker; lane 1,blank; lane 2, B2R; lane 3, A39R; lane 4, ATI; lane 5, F3L; lane 6, HA. (F) Conventional polymerase chain reaction products of 43 InDels and 8 SNP mutations of WIBP-MPXV-001 compared with the mpox/PT0001/2022. (G) Metagenomics analysis of next-generation sequencing of cells infected with the virus.
Figure 2. Sequence analysis of WIBP-MPXV-001 isolated in Vero E6 cells. (A) Phylogenetic tree of WIBP-MPXV-001. (B) NR species distribution map of WIBP-MPXV-001. (C) Genome circle map of WIBP-MPXV-001. From the outside to the inside, the first circle is genome sequence, the second and third circle are G:C content and GC skew curve respectively, the fourth circle is sequencing depth and coverage information, and the fifth circle shows CDS and non-coding regions. (D) Go analysis of WIBP-MPXV-001.
Figure 3. Detection of MPXV IgG and neutralizing antibodies by ELISA and PRNT. (A) Plaque reduction assay of serum against MPXV. (B) The inhibitory curve for positive sera. (C) Neutralizing activity of sera from individuals (N = 30) who were born before 1981 and after 1981. (D) Geometric mean titre (GMT) of neutralizing antibodies against MPXV. (E) MPXV IgG antibodies of sera from individuals (N = 30) who were born before 1981 and after 1981 by ELISA. (F) GMT of IgG antibodies by ELISA. There were two people born in the same year such as 1968, 1969, 1977, 1992, 1996, 1997, and 1999 respectively, which resulted in 23 data points shown (7 data points less) in C and E. Data shown are geometric mean titres. Error bars represent geometric standard deviations. Data were analysed by the one-way ANOVA tests and t-test analysis. P < 0.05 was considered statistically significant. *P < 0.05.
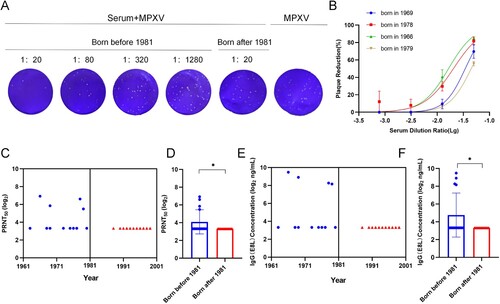
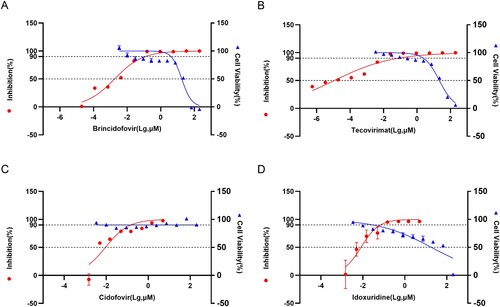
Figure 4. Drug Inhibition Test. (A) Cytotoxicity of Brincidofovir and its Inhibition efficiency on WIBP-MPXV-001 (B) Cytotoxicity of Tecovirimat and its Inhibition efficiency on WIBP-MPXV-001 (C) Cytotoxicity of Cidofovir and its Inhibition efficiency on WIBP-MPXV-001 (D) Cytotoxicity of Idoxuridine and its Inhibition efficiency on WIBP-MPXV-001.