Figures & data
Figure 1. Genetic ablation of cell surface sialic acid expression and its impact on PRV infection. (A) HeLa and HeLaΔSLC35A1 cells were immunostained with FITC-conjugated WGA. Green fluorescence indicates sialic acid expression. Susceptibility of HeLa and HeLaΔSLC35A1 cells to (B) influenza A/NWS/33 and (C) PRV3M infections. Data presented were virus yield at 48 hpi. (D) PRV-induced syncytial formation was observed via immunofluorescent staining for viral antigen. Blue indicates cell nuclei and brown indicates PRV3M antigens. All experiments were repeated for at least two biological replicates. Asterisks indicate statistically significant differences (*P < 0.05; **P < 0.01; ***P < 0.001). Error represent means ± standard error.
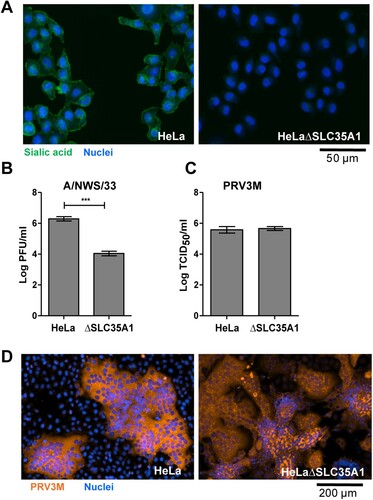
Figure 2. Impact of heparinases I and III treatment on PRV infection of HeLa cells. HeLa cells were pre-treated with heparinase I and III blend (Sigma) for 1 h prior PRV3M infection. Total virus yields were determined at 48 hpi by end-point dilution. Experiments were repeated for at least two biological replicates. Asterisks indicate statistically significant differences (*P < 0.05; **P < 0.01; ***P < 0.001). Error represent means ± standard error.
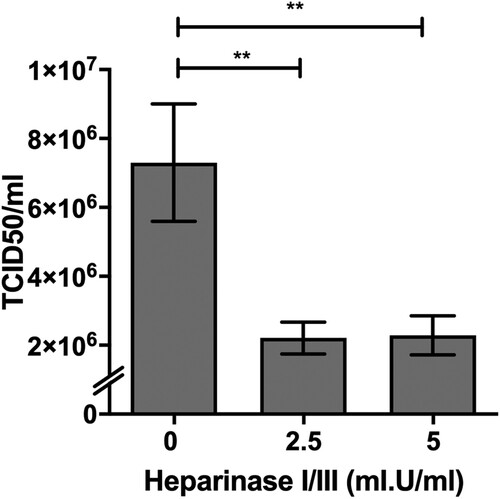
Figure 3. Illustration of HS biosynthesis pathway, and effect of genetic ablation of HS biosynthesis genes on HS expression. (A) HS biosynthesis takes place in the Golgi lumen. Xylosyltransferases (XYLT1,2), galactosltransferases (B4GALT7, 6) and glucuronyltransferase (B3GAT3) involved in the biosynthesis of xylose-galactose-galactose-glucuronic acid protein-glycan linkage. N-acetylglucosaminyltransferase (EXTL2) catalyze synthesis of the glucuronic acid-N-acetyl-glucosamine. EXT1,2 catalyze chain elongation with N-acetyl-glucosamine and glucuronic acid. Glucuronyl C5-epimerase performs epimerization of glucuronic acid to l-iduronic acid and adenosine 3′-phospho 5′-phosphosulphate (PAPS) transporter 1 (SLC35B2) transport the PAPS from cytosol into Golgi lumen. N-deacetylase/N-sulfotranferases (NDST1–4) perform deacetylation and N-sulphation of the N-acetyl-glucosamine. HS 2-O-sulfotransferase is involved in transferring of sulphate group to the 2′ of the iduronic acid residue of HS. Both HS 3-O and HS 6-O sulfotransferases are involved in transferring of sulphate group to the 3′ and 6′ of the N-acetyl-glucosamine residue of the HS. (B) Illustration of HS biosynthesis in ΔEXT-1, ΔSLC35B2 and ΔB3GAT3 cells. HS expression in HeLa wild-type and knockout cells were analysed via flow cytometry using anti-HS monoclonal antibody, F58-10E4. All experiments were repeated for at least two biological replicates.
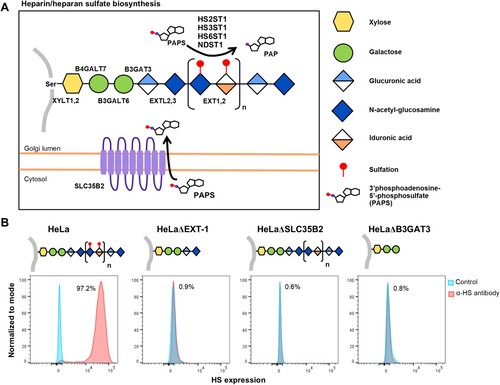
Figure 4. Effect of HS deficiency in PRV3M infection. The susceptibility of HeLaΔEXT-1, HeLaΔSLC35B2 and HeLaΔB3GAT3 cells to (A–C) PRV3M, (D–F) HSV-1 and (G–I) influenza A/NWS/33. The data presented were virus yields at 48 hpi. (J) Immunofluorescent staining for viral antigen was performed to validate PRV3M infection in HeLa, HeLaΔEXT-1, HeLaΔSLC35B2 and HeLaΔB3GAT3 cells. Blue indicates cell nuclei and brown indicates PRV3M antigens. Scale bar is for the enlarged images. All experiments were repeated for at least two biological replicates. Asterisks indicate statistically significant differences (*P < 0.05; **P < 0.01; ***P < 0.001). Error represent means ± standard error.
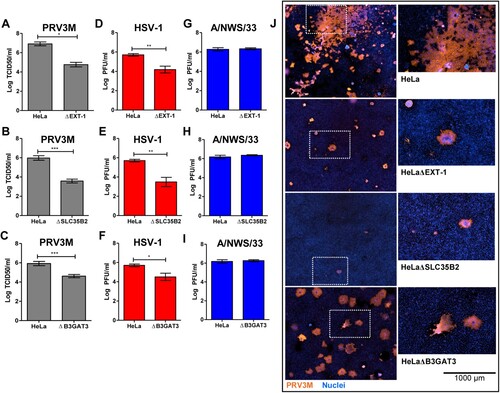
Figure 5. Role of HS in facilitating infection by multiple genetically diverse PRV species. (A) Phylogenetic analysis of PRV and MRV S1 genes. Phylogenetic tree was built using neighbour joining method with 1000 bootstrapping. Filled circles indicate the PRV species used in this study. (B) The syncytia formation of PRV2P, PRV3M, PRV4K and PRV7S infected HeLa, HeLaΔEXT-1, HeLaΔSLC35B2 and HeLaΔB3GAT3. At 48 hpi, the cells were fixed with 4% paraformaldehyde and stained with 0.2% crystal violet. Susceptibility of (C) HeLaΔEXT-1 and (D) HeLaΔSLC35B2 to PRV1N, PRV2P, PRV4K and PRV7S infection. The virus titres were determined at 48 hpi by end-point dilution. All experiments were repeated for at least two biological replicates. Asterisks indicate statistically significant differences (*P < 0.05; **P < 0.01; ***P < 0.001). Error represent means ± standard error.
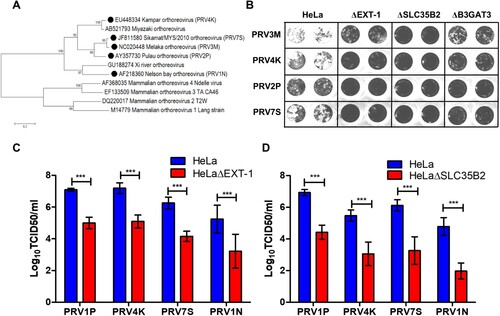
Figure 6. Reconstitution of knockout genes restores HS biosynthesis and PRV3M infectivity. (A, B) Flow cytometry analysis of HeLaΔSLC35B2 and HeLaΔB3GAT3 transduced with lentiviruses for stable expression of SLC35B2 and B3GAT3, respectively. Knockout cells transduced with an empty vector were used as control. Effect of HeLaΔSLC35B2 transduced with lentivirus expressing SLC35B2 and empty vector on PRV3M and PRV2P infection, as measured via (C) virus yields, (D) immunofluorescence staining for viral antigen and (E) virus-induced syncytial formation. B3GAT3 or empty vector transduced HeLaΔB3GAT3 were infected with PRV3M and PRV2P at a MOI of 1. The effect on (F) virus yields, (G) immunofluorescence staining for viral antigen and (H) syncytial formation of PRV2P and PRV3M were determined. All experiments were repeated for at least two biological replicates. Asterisks indicate statistically significant differences (*P < 0.05; **P < 0.01; ***P < 0.001). Error represent means ± standard error.
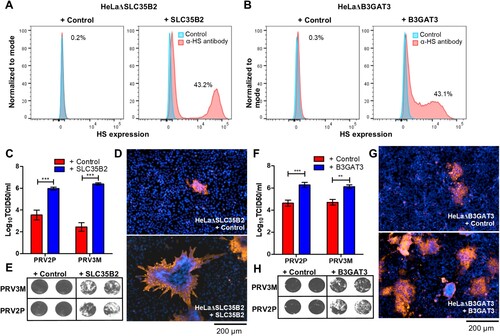
Figure 7. Effect of genetic ablation of genes involved in HS modifications on susceptibility to PRV3M infection. (A) Graphical illustration of HS chain in NDST-1, HS2ST-1 and HS6ST-2 deficiency. Blue diamond indicates de-acetyl-glucosamine; open diamond indicates N-acetyl-glucosamine, half blue diamond indicates glucuronic acid; half orange diamond indicates iduronic acid and red mark indicates sulphation. Flow cytometry histogram plots of HeLa, HeLaΔNDST-1, HeLaΔHS2ST-1 and HeLaΔHS6ST-2 cells on surface HS expression. (B) Effect of NDST-1, HS2ST-1 and HS6ST-2 knockout in PRV3M, HSV-1 and A/NWS/33 infection. All experiments were repeated for at least two biological replicates. Asterisks indicate statistically significant differences (*P < 0.05; **P < 0.01; ***P < 0.001). Bar charts represent mean ± standard error.
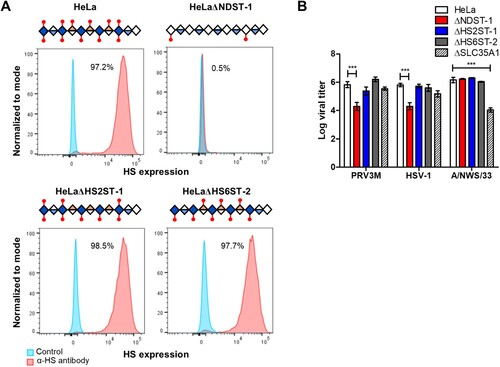
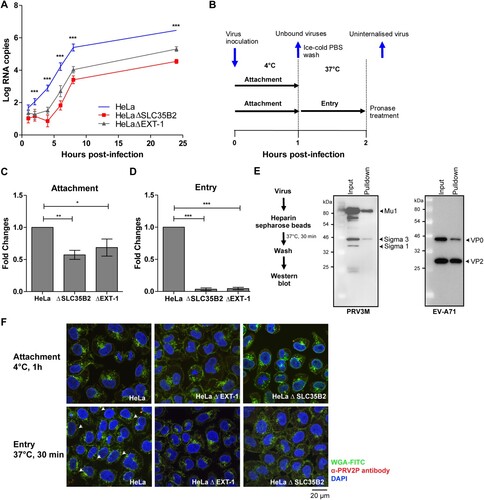
Figure 8. Replication kinetics and mechanistic studies of PRV3M attachment and entry. (A) Replication kinetics of PRV3M in HeLa, HeLaΔEXT-1 and HeLaΔSLC35B2 cells. Viral RNA copies at 1, 2, 4, 6, 8, 24 hpi were quantified by real-time PCR. (B) Illustration of experimental procedure to characterize virus attachment and entry. Ice-cold PRV3M inoculum was added on to pre-chilled HeLa, HeLaΔEXT-1 and HeLaΔSLC35B2 cells and incubated on ice for 1 h. At 1 hpi, cells were washed three times with ice-cold DPBS to remove unbound viruses. Infected cells were either harvested for total RNA extraction or incubated at 37°C incubation for 1 h to promote virus entry. Cells were then incubated with pronase at a final concentration of 1 mg/ml for 10 min at 37°C. This step removes membrane-bound, but uninternalized virus particles. Pronase-treated cells were subjected to extensive washes prior to total RNA extraction. (C) Effect of EXT-1 and SLC35B2 knockout on PRV3M attachment. (D) Attachment of PRV3M and EV-A71 virion to heparin sepharose beads followed by Western blot analysis. (E) Internalization analysis of PRV3M in EXT-1 and SLC35B2 knockout cells. Fold changes of viral gRNA were determined using 2−ΔΔCT method after normalization with a housekeeping gene, SNRPD3. (F) Confocal analysis of PRV3M attachment and entry. Cell membrane (green) was immunostained with FITC-WGA, PRV3M (red) was immunostained with antiserum derived from rabbit hyperimmunized with PRV2P and nuclei (blue) were stained with DAPI. Arrow indicates internalized viral particles. The images were acquired using Nikon N-STORM confocal microscope at 60× magnification. All experiments were repeated for at least two biological replicates. Asterisks indicate statistically significant differences (*P < 0.05; **P < 0.01; ***P < 0.001). Error represent means ± standard error.