
Figures & data
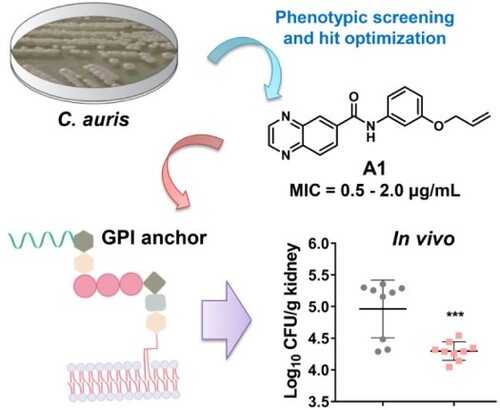
Figure 1. Discovery of benzoanilide lead compounds against C. auris. (a) Protocol for phenotypic screen and molecule design based on the hit compound NMU-6. Relative growth of fungal cells was displayed by heatmap. (b) Chemical structures of the designed target compounds. The shaded regions indicate compounds that showed potent antifungal activity.
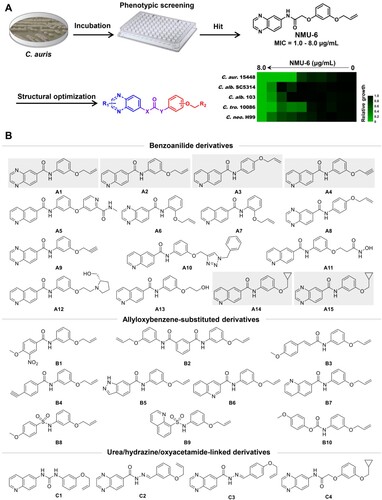
Figure 2. Selection of compounds A1 and A2 as potent antifungal lead compounds. (a) The antifungal activities of compounds against C. auris. (b) The antifungal activities of compounds against C. albicans, C. tropicalis and C. neoformans, filled and empty circles indicate FLC-resistant and FLC-sensitive strains, respectively. (c) The antifungal potency of compounds A1 and A2. Relative growth of fungal cells was displayed by heatmap. Abbreviations: C. alb., Candida albicans; C. tro., Candida tropicalis; C. neo., Cryptococcus neoformans; C. aur., Candida auris; C. gla., Candida glabrata; C. lus., Candida lusitaniae; C. par., Candida parapsilosis.
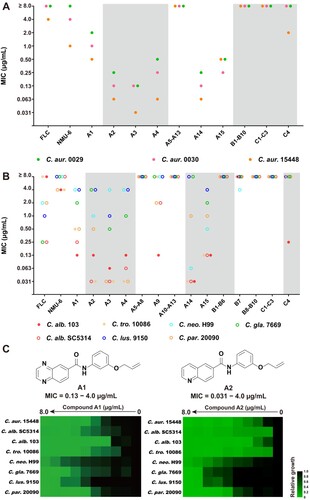
Figure 3. In vitro and in vivo antifungal activities of compounds A1 and A2 against C. auris. (a) Inhibition of compounds A1, A2 and FLC on C. auris 0029 biofilm formation and (b) mature biofilm. (c) Time-growth curve of C. auris 0029 treated by compound A1, A2 and FLC. (d) In vivo antifungal efficacy of compounds A1 and A2 in IFIs mice model, fungal burden of kidneys in mice infected by C. auris 0029 or C. albicans 103. *P < 0.05, **P < 0.01, ***P < 0.001, and ****P < 0.0001, vs. the control group, determined by one-way ANOVA.
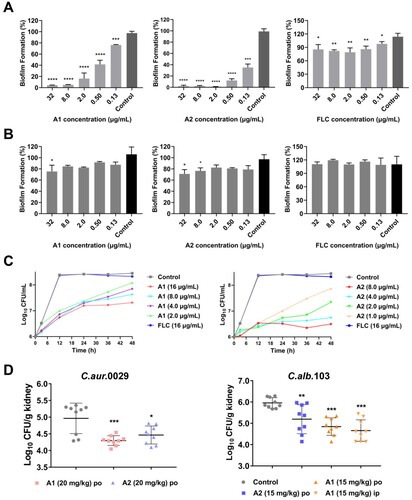
Figure 4. Anti-virulence effects of compounds A1 and A2 against azole-resistant C. albicans 103. (a) Inhibition of biofilm formation; (b) Inhibition of mature biofilm; (c) Inhibition of hypha formation, scale bar represents 50 µm. (d) Time-growth curve of C. albicans 103 treated by compounds A1, A2 and FLC. *P < 0.05, **P < 0.01, ***P < 0.001, and ****P < 0.0001, vs. the control group, determined by one-way ANOVA.
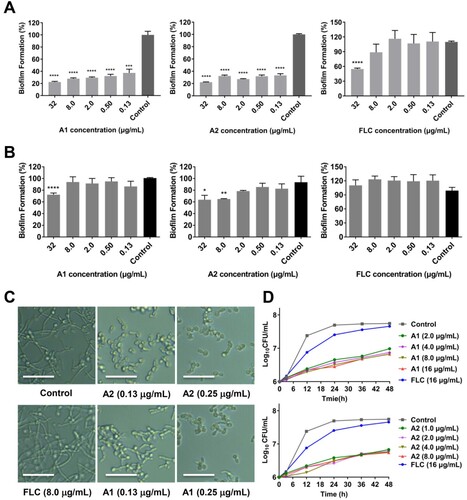
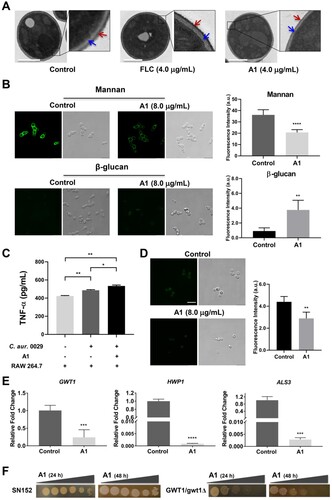
Figure 5. Mechanism-of-action of compound A1. (a) Transmission electron images of drug-resistant C. auris 0029 after incubating with FLC and compound A1. The red and blue arrows indicate the mannan coats and β-glucan layer, respectively. Scale bar represents 1 µm. (b) Fluorescence intensity assay of mannan and β-glucan in C. auris 0029 cell walls after treatment with compound A1. Scale bar represents 10 µm. **P < 0.01, and ****P < 0.0001, vs. the control group, determined by two-tailed unpaired Student’s t-test. (c) The TNF-α concentration analysis by co-culture of macrophages RAW264.7 and C. auris 0029 treated by compound A1 (8.0 μg/mL). *P < 0.05, and **P < 0.01, determined by one-way ANOVA. (d) FLAER staining of GPI-anchored proteins in fungal cells. Scale bar represents 10 µm. **P < 0.01, vs. the control group, determined by two-tailed unpaired Student’s t-test. (e) The regulatory effects of compound A1 on GWT1, HWP1, and ALS3 genes of C. albicans 103 through real-time RT-PCR analysis. ***P < 0.001, and ****P < 0.0001, vs. the control group, determined by two-tailed unpaired Student’s t-test. (f) Effects of GWT1 knockdown on drug sensitivities. Plates contained increasing concentrations of compound A1 to 0.25 μg/mL.
Supplemental Material
Download MS Word (188.5 KB)Supplemental Material
Download MS Word (1.6 MB)Data availability statement
All the data including experimental procedures, synthetic methods, structural characterization and spectra data are available in the supplementary information files.