Figures & data
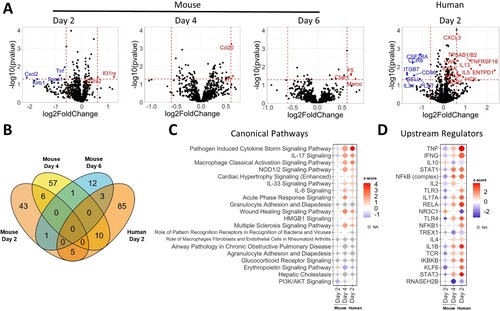
Figure 1. ΔSGF and ΔLSG enhance nsp6 suppression of IFN-α signaling. (A) Alignment of parental and variant nsp6 amino acid sequences of the region containing the independently acquired triple deletions. Delta nsp6 contains a unique V149A mutation and BA.1 nsp6 contains I189V in addition to ΔLSG. (B) Diagram of the predicted structure of nsp6 with enumerated transmembrane domains and the 105–108 region, where ΔSGF and ΔLSG occur, highlighted in yellow. (C) Schematic of the parental WA1, Alpha variant, and mutant ΔSGF-WA1 infectious clone generated by reverse genetics. (D) Representative images of plaque morphologies and (E) comparison of average plaque sizes. (F) Viral titers from a growth kinetics experiment where Vero E6-TMPRSS2 cells were infected at MOI 0.02 and supernatants were collected for plaque assays. (G) Raw viral titers from supernatants of Vero E6-TMPRSS2 cells infected with SARS-CoV-2 viruses at MOI 0.02 and treated with 2-fold serial dilutions of IFN-α. (H) Viral titers from (G) presented as a percent of untreated controls (0 IFN-α U/mL). (I) Extracellular viral RNA from supernatants of IFN-α treated quantified by RT-qPCR using a standard curve. (J) Extracellular viral RNA from (I) normalized to untreated controls (0 IFN-α U/mL). (G-J) Data are representative of three replicate experiments. (K) Western blot validating protein expression of nsp6 variant genes from pXJ plasmids in HEK293T cells. (L) IFN-α induction assay and (M) IFN-α signaling assay in HEK293T cells; values represent measured Firefly luciferase signals normalized to Renilla luciferase signals then normalized to the vector control; data are combined from at least three replicate experiments; no statistical differences were detected for (L). (N) Western blot demonstrating expression of nsp6 variant genes from pXJ plasmids in HEK293T. (O) IFN-α signaling assay in HEK293T cells presented as in (M). (P) Representative Western blot from three replicate experiments measuring levels of phosphorylated STAT1 or STAT2 (pSTAT1 or pSTAT2) in cells transfected with respective variant nsp6 genes and treated with IFN-α; values represent fold change of pSTAT1 or pSTAT2 for each variant nsp6 gene relative to vector control and normalized to GAPDH. Significance was determined using One-Way ANOVA with ns (not significant), p ≤ 0.05 (*), p ≤ 0.01 (**), and p ≤ 0.001 (***). Diagram (B) was created using BioRender. Additional figures created using GraphPad Prism 9.
Figure 2. ΔSGF-WA1 outcompetes WA1 in HAE cells and augments disease severity in mice. (A) Extracellular viral titers and (B) levels of viral RNA over 96 h from supernatants of infected HAE cells at MOI 0.4 using (A) plaque assays and (B) RT-qPCR with a standard curve. (C) Levels of intracellular viral RNA from infected HAE cell lysates normalized to GAPDH. (D) Competition assay from the supernatants of HAE cells infected with equal MOI of WA1 and ΔSGF-WA1. Copy numbers of each virus were quantified using next-generation sequencing and are presented as percentages of the total number of viral copies. (E) Viral RNA measured by RT-qPCR from infected mouse lung tissues normalized to tissue weights measured by plaque assays. Samples were harvested on days 2 (10 mice per virus), 4 (14 mice per virus), and 6 (14 mice per virus; and 4 mock-infected mice). (F) Average weights of mice infected with WA1 SARS-CoV-2 or ΔSGF-WA1 measured daily. Significance is based on a comparison of ΔSGF-WA1 to WA1. (G) Average weights of infected mice and (H) survival curves over 15 days (10 mice per group). Mice were humanely euthanized if the weight dropped below 80% initial weight (dashed line). Significance was determined using Student’s T-test for each timepoint compared to WA1 or using a Log-rank Mantel-Cox test (H) with p ≤ 0.05 (*), p ≤ 0.01 (**), and p ≤ 0.001 (***).
Figure 3. ΔSGF alters host responses causing extensive cytokine expression. (A) Volcano plots from nCounter Analysis for mouse whole lung specimens and human airway epithelial cultures (HAE) at specified days post infection. All comparisons are between nsp6 mutant and WT. Horizontal dotted line corresponds to a p-value cutoff of 0.05 and vertical lines correspond to −0.6 and 0.6 log2(fold change). (B) Venn diagram of differentially expressed genes between four conditions (Day 2 mouse, Day 4 mouse, Day 6 mouse, and Day 2 HAE). (C) Bubble plot of the top 20 statistically significant canonical pathways by ascending p-value from comparison analysis in Ingenuity Pathway Analysis. Dot size corresponds to –log(p-value). Colour corresponds to activation z-score communicating the directionality (activation or inhibition) for that pathway. Grey indicates z-score values which could not be calculated. (D) Bubble plot of the top 20 statistically significant upstream regulators by ascending p-value from comparison analysis in Ingenuity Pathway Analysis.