Figures & data
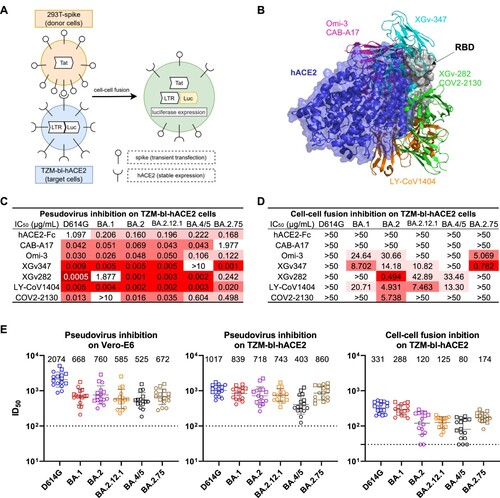
Figure 1. Resistance of cell-cell fusion induced by SARS-CoV-2 to monoclonal antibody and polyclonal serum neutralization. (A) Schematic illustration of the cell-cell fusion assay. Briefly, 293 T cells that were transiently transfected with the HIV-1 trans-activator of transcription (Tat) gene and SARS-CoV-2 spike gene were used as the donor cells. The target cells were TZM-bl-hACE2 cells that contained the firefly luciferase (luc) gene regulated by the long terminal repeat (LTR) promoter. Upon co-culture, spike protein on donor cells bound to the hACE2 receptors on target cells and initiated membrane fusion. In the syncytia, Tat proteins activated the LTR promoter, causing luc gene expression, which was quantified by luciferase reporter assay to evaluate the cell-cell fusion activity. (B) Structural modelling of RBD, hACE2, and mAbs. Different colours indicate different classes of mAbs, as grouped by their epitopes. (C) Pseudovirus neutralization IC50 titres for mAbs against D614G and Omicron subvariants on TZM-bl cells. (D) Cell-cell fusion inhibition IC50 titres for mAbs against D614G and Omicron subvariants. (E) Pseudovirus neutralization and cell-cell fusion inhibition ID50 titres for sera against D614G and Omicron subvariants. Each point represents a serum sample, with square and circle showing samples from individuals who received 3 doses of COVID-19 mRNA vaccines with and without breakthrough infection, respectively. Data are shown as geometric mean ± SD. Horizontal solid bar indicates the geometric mean of ID50 titres. Horizontal dotted line denotes the limit of detection (LOD) at 100 or 30. Data shown in C-E are representative of one in three independent experiments.