Figures & data
Figure 1. Characterization of hiAT2 organoids. (A) Schematic diagram illustrating differentiation protocol. The lower panel shows representative images of differentiated cells in each step. (B) Confocal image of immunofluorescence detection of alveolar type II cell markers (SFTPC and SFTPD), SARS-CoV-2 entry receptors (ACE2 and TMPRSS2), alveolar type I cell marker (AQP5), epithelial cell marker (EPCAM) and, FLUAV entry receptors (MALII and SNA) in hiAT2 organoids. Scale bars = 50 μm. (C) Relative mRNA expression of pluripotent stem cell marker, OCT4 and SARS-CoV-2 entry receptors, ACE2 and TMPRSS2 in hiAT2 organoids. Data are mean ± SD. n = 3 independent biological replicates and two technical replicates each. *p < 0.05, ***p < 0.001, unpaired Student’s t-test. (D) Protein levels of ACE2 and TMPRSS2 in hiAT2 organoids as determined by Western blotting.
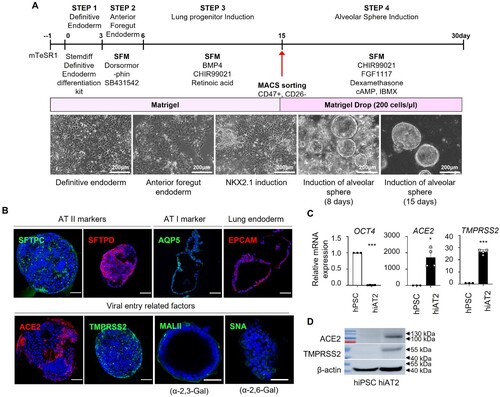
Figure 2. Single-cell transcriptome analysis of hiAT2 organoids. (A) Unsupervised tSNE clustering of uninfected hiAT2 organoid. (B) Single-cell RNA expression data across clusters displayed in violin plot. (C) The average expression levels of specific gene markers across the cells within the cluster presented by colour intensity and the extent of expression presented by the size of the dot. (D) Expression of genes showing general features of hiAT2 organoids in the dataset. (E) Composition of different cell-types in hiAT2 organoids. (F) Gene ontology analysis showing biological differences between the clusters.
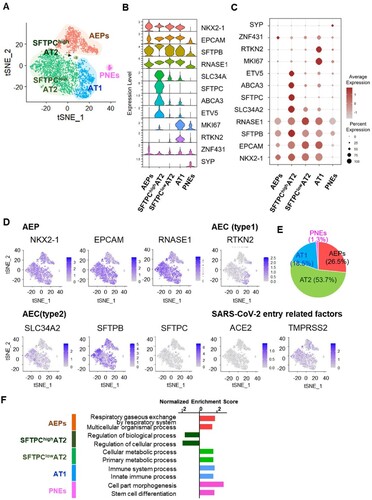
Figure 3. Infection of hiAT2 organoids with SARS-CoV-2 and FLUAV. (A) Schematic diagram illustrating infection process of hiAT2 organoids. (B) Plaque assay and representative images showing the replication of SARS-CoV-2 delta and SARS-CoV-2 omicron variant in hiAT2 organoids (n = 3) ***p < 0.001, Two-way ANOVA with Bonferroni’s multiple comparisons test. (C) Plaque assay and representative images showing replication of SARS-CoV-2 delta in hiAT2 organoids infected with SARS-CoV-2 delta alone or with FLUAV (Delta + FLUAV) (n = 3, independent experiments) ****p < 0.0001, Two-way ANOVA with Bonferroni’s multiple comparisons test. (D) Plaque assay and representative images showing replication of SARS-CoV-2 omicron in hiAT2 organoids infected with SARS-CoV-2 omicron alone or with FLUAV (Omicron + FLUAV) (n = 3, independent experiments). ****p < 0.0001, Two-way ANOVA with Bonferroni’s multiple comparisons test. (E) Confocal images of immunocytochemistry stained for SARS-CoV-2 viral particle and nucleoprotein of FLUAV (H1N1) in hiAT2 organoids infected with SARS-CoV-2 delta, SARS-CoV-2 omicron and/or with FLUAV. Scale bars = 50 μm. (F) Representative images of cell morphologies in hiAT2 organoids infected with SARS-CoV delta, SARS-CoV omicron and/or with FLUAV at 3 dpi.
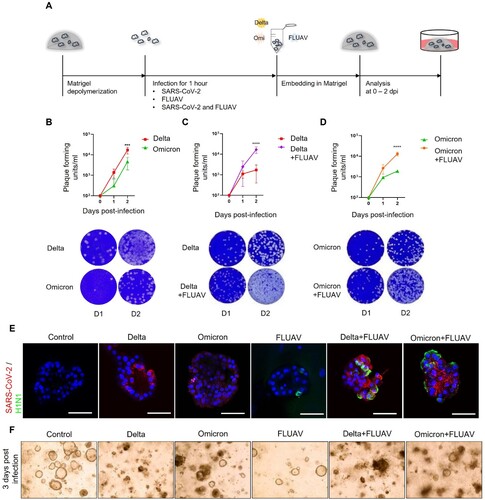
Figure 4. FLUAV infection increases ACE2 and TMPRSS2 in hiAT2 organoids. (A) Relative mRNA expression of SARS-CoV-2 entry receptors in hiAT2 organoids infected with FLUAV at 2 dpi. Data are mean ± SD. n = 4 independent biological replicates and four technical replicates each. ****p < 0.0001, ***p < 0.001, **p < 0.01, a one-way ANOVA with Tukey’s multiple comparisons test was performed to analyze intergroup differences. (B) Representative confocal images of hiAT2 organoids stained for ACE2 and nucleoprotein of FLUAV (H1N1). Control refers to uninfected cells. Scale bar = 50 µm. (C) Quantification of the percentage of positive cells in the confocal images of hiAT2 organoids infected with FLUAV alone, delta variant plus FLUAV, and omicron variant plus FLUAV. Data are mean ± SD; each dot indicates independent biological replicates. *p < 0.05, **p < 0.01, a one-way ANOVA with Tukey’s multiple comparisons test was performed to analyze intergroup differences.
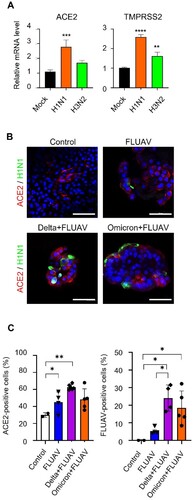
Figure 5. SARS-CoV-2 infection enhances FLUAV replication and induces expression of α2,6-Gal sialic acid in hiAT2 organoids. (A) Fold change of replication of FLUAV in hiAT2 organoids infected with H1N1 alone and delta or omicron variants with FLUAV compared to FLUAV on day 1. Data are mean ± SD. n = 3; independent biological replicates and two technical replicates each. ***p < 0.001 for FLUAV vs. Delta + FLUAV at day 2 post infection. A one-way ANOVA with Tukey’s multiple comparisons test was performed to analyze intergroup differences. (B-C) MAL II (bind to α-2,3-Gal sialic acid) and SNA (bind to α-2,6-Gal sialic acid) positive cells in hiAT2 organoids infected with delta or omicron variant of SARS-CoV-2 by immunofluorescence analysis. Scale bar = 50 μm. Control refers to uninfected cells. The quantitative data are mean ± SD. n = 3 independent biological replicates. *p < 0.05 A one-way ANOVA with Tukey’s multiple comparisons test was performed to analyze intergroup differences.
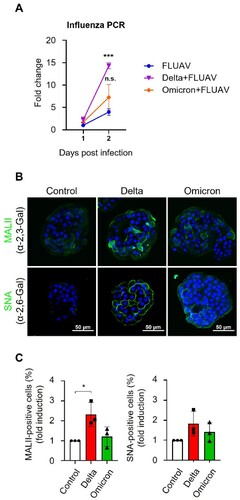
Figure 6. RNA-sequencing analysis of hiAT2 organoids infected with SARS-CoV-2 variant and/or FLUAV. (A) Principal component analysis of differential gene expression in hiAT2 organoids infected with delta SARS-CoV-2, omicron SARS-CoV-2 and/ or with FLUAV (H1N1) (n = 2 or, n = 3 biological replicates per condition). Control refers to uninfected organoids (B) Heatmap of inflammatory gene sets in in hiAT2 organoids infected with delta SARS-CoV-2, omicron SARS-CoV-2 and/ or with FLUAV (H1N1). (C) Volcano plots showing DEGs between delta alone vs. delta plus FLUAV; omicron alone vs. omicron plus FLUA; FLUAV alone vs. delta plus FLUAV; FLUAV alone vs. omicron plus FLUAV. (D) Heatmap of “SARS-CoV-2 entry receptor-related genes” in organoids infected with SARS-CoV-2 variant (delta or omicron) alone or with FLUAV (E) Heatmap displaying “ER stress-related genes” in uninfected organoids (control) or hiAT2 organoids infected with delta variant and delta variant plus FLUAV. (F) Reactome pathway analysis of hiAT2 organoids infected with SARS-CoV-2 delta variant alone and together with FLUAV (H1N1) using DEGs. (G) Reactome pathway analysis of hiAT2 organoids infected with FLUAV (H1N1) alone and together with delta variants using DEGs.
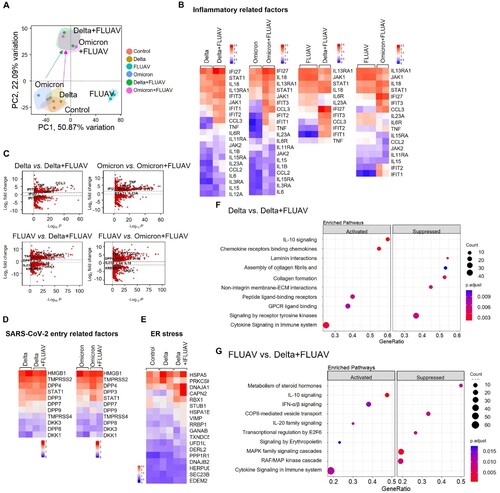
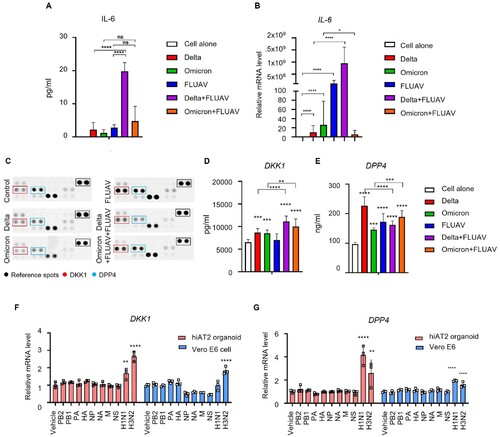
Figure 7. Increase in IL-6, DKK1 and DPP4 levels in hiAT2 organoids coinfected with SARS-CoV-2 and FLUAV. (A-B) IL-6 expression (protein (A) and mRNA (B)) in hiAT2 organoids infected with SARS-CoV-2 alone (delta or omicron variant), FLUAV alone or co-infected with SARS-CoV-2 variants with FLUAV. Data are mean ± SD. n = 3 independent biological replicates and two technical replicates each. ****p < 0.0001, one-way ANOVA with Tukey’s multiple comparisons test was performed to analyze intergroup differences. (C) Proteome cytokine array (DPP4 and DKK1) in hiAT2 organoids infected with SARS-CoV-2 alone (delta or omicron variant), FLUAV alone or co-infected with SARS-CoV-2 variants with FLUAV. (D-E) Secreted DKK1 (D) and DPP4 (E) levels in the culture media of hiAT2 organoids infected with SARS-CoV-2 alone (delta or omicron variant), FLUAV alone or co-infected with SARS-CoV-2 variants with FLUAV. (F-G) mRNA expression of DKK1 and DPP4 in hiAT2 organoids and Vero E6 cells transfected with plasmid containing cDNA for each of the eight viral RNA segments or infected with whole virion (H1N1 and H3N2) at 1-day post-infection.