Figures & data
Figure 1. Passaging in C22 swine lung cells affects viral replication. (A) Schematic outline of the experimental strategy. (B, C) C22 cells were infected with (B) R1738/10 (parental strain) or C22-passaged variants (R-1, R-2, R-5, R-7, R-13) or with (C) pdm09 (parental strain) or C22-passaged variants (P-1, P-2, P-5, P-6, P-14) with MOI 0.001. Virus-containing supernatants were collected at 24 h p.i. and virus titers were determined by standard plaque assays. Virus titers are depicted as mean ± SD of three biological replicates. One representative out of two independent experiments is shown. Statistical significance was determined by one-way ANOVA and Dunnett’s multiple comparison test against R1738/10 with *p ≤ 0.033, ** p ≤ 0.002, *** p ≤ 0.001.
Table 1. Coding mutations in segments derived from R1738/10 respectively pdm09.
Figure 2. The model gave rise to numerous reassortants. (A) Schematic depiction of the novel bioinformatic pipeline used to process sequencing data. (B) Sequencing depth (number of reads aligning to reference segments) versus nucleotide position are plotted. Reads from pdm09 were aligned against the reference genomes of pdm09 or R1738/10 strains and the best match was kept. Reads mapping against the pdm09 (blue) or R1738/10 (orange) reference are shown for each segment. (C) Segment origin of all strains was determined by RT-qPCR genotyping and confirmed by NGS. Segments derived from R1738/10 are depicted in orange and those derived from pdm09 in blue. (D) C22 or A549 cells were infected with parental strains R1738/10 or pdm09 or with co-infection isolates at low MOI (C22: 0.001; A549: 0.05). Virus-containing supernatants were collected at the indicated time points and viral titers were determined by standard plaque assays. Viral titers are depicted as mean ± SD of three independent experiments. Statistical significance was determined by two-way ANOVA and Dunnett’s multiple comparison test against pdm09 with *p ≤ 0.033, ** p ≤ 0.002, *** p ≤ 0.001. Significant differences were only found 48 h p.i. For C22: RCo-1, Rpdm-PB1/PA-1, Rpdm-PB1/PA/NA-1 and Rpdm-PB1/PA/NA-3 ***, RCo-2 **. For A549: RCo-1, RCo-2 and Rpdm-PB1/PA-1 ***, Rpdm-PB1/PA/NA-1 **.
Figure 3. The originated mutations and reassortments could change essential protein functions. 3D homology models (partially shown) of (A) HA of pdm09 or of variant P-5, which carries the N129D mutation and (B) of HA1 of R1738/10 or of variant R-5, which carries the R186S mutation. Surface view of HA1 is shown, where the globular head domain (blue), all receptor binding sites (magenta) and (A) residue 129 or (B) residue 186 (red) are indicated. Gradient colourings indicating Coulombic electrostatic potential are shown. Position (A) 129 or (B) 186 and its surroundings are indicated by a black circle. (C) C22 or (D) HEK293T cells were transfected with the vRNP and a luciferase under a viral promotor. Luciferase activity was measured 24 h p.i. In reassorted RNPs, the proteins derived from pdm09 are indicated in the index. RLUs were normalized to R1738/10, and activities (coloured bars) are the mean of 3–8 independent experiments. Grey lines indicate the corresponding virus titer in (C) C22 or (D) A549 cells as determined in and , normalized to R1738/10 and shown logarithmic on the right y-axis as relative mean ± SD. Statistical significance was determined by one-way ANOVA and Dunnett’s multiple comparison test against R1738/10 with *p ≤ 0.033, ** p ≤ 0.002, *** p ≤ 0.001.
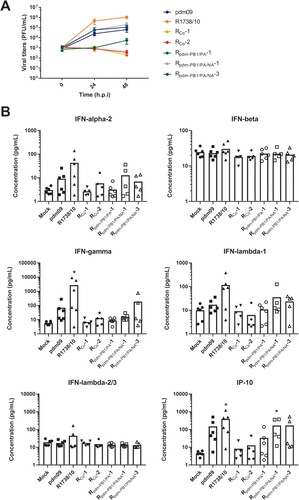
Figure 4. Reassortants efficiently infect human lung tissue explants ex vivo. (A, B) Human lung tissue explants were infected with parental strains R1738/10 or pdm09 or with co-infection isolates. Virus-containing supernatants were collected at 1, 24 and 48 h p.i. and (A) virus titers were determined by standard plaque assays. Virus titers were normalized to 100 mg of lung tissue and are depicted as mean ± SEM of 5–6 independent experiments. Statistical significance was determined by two-way ANOVA and Dunnett’s multiple comparison test against pdm09 with *p ≤ 0.033, ** p ≤ 0.002, *** p ≤ 0.001. Only R1738/10 showed significant differences with * at 24 h p.i. and *** at 48 h p.i. (B) Cytokine/chemokine levels in the supernatants were determined and normalized to 100 mg of lung tissue. Results from 5–6 independent experiments are depicted with the mean indicated as a column. Statistical significance was determined by Kruskal Wallis non-parametric test against Mock with *p ≤ 0.033, ** p ≤ 0.002, *** p ≤ 0.001.